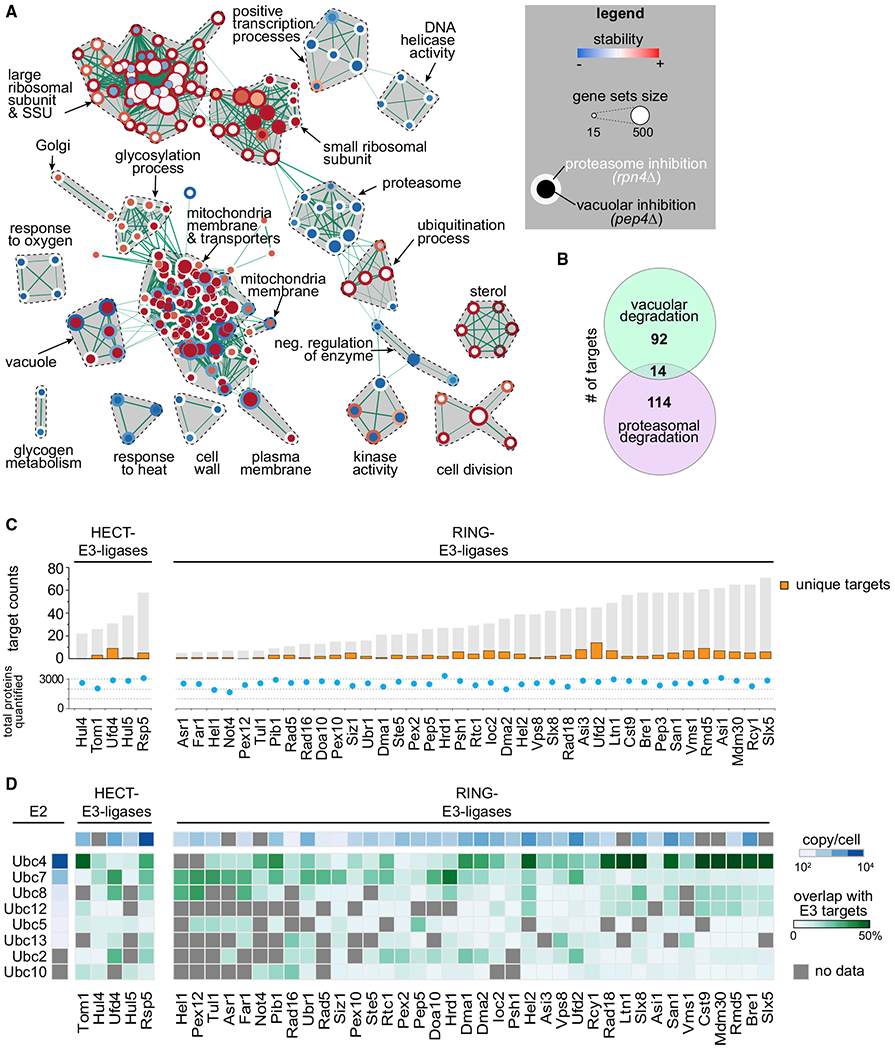
Figure 2. Turnover Effects of Lysosomal and Proteasomal Pathway Perturbations.

(A) Enrichment map of gene set enrichment analysis (GSEA) for proteins affected by inhibition of proteasomal and lysosomal degradation (p = 0.005, q = 0.1). Nodes represent gene sets that are enriched at the top or bottom of the ranking of differentially affected proteins (as determined by GSEA). Node size corresponds to the number of genes in the set. Edges indicate the overlap between gene sets, and the thickness indicates the size of the overlap. Red indicates increased and blue indicates decreased turnover. Node center corresponds to the effect of vacuolar degradation inhibition (pep4Δ cells), whereas node rims correspond to the effects of proteasomal degradation inhibition (rpn4Δ cells).
(B) Venn diagram representing the number of vacuolar (proteins stabilized in pep4Δ) and proteasomal (stabilized in rpn4Δ) targets.
(C) Number of targets of HECT and RING E3 ligases present in the T-MAP. Unique targets are indicated in orange. Shared targets are indicated in gray (shared between at least 2 E3 ligases). Total quantified proteins per mutant are indicated with blue dots.
(D) Target overlap between E3 and E2 enzymes (in percentage of E3 ligases total targets, green). E3 and E2 enzyme abundances are indicated (blue). Gray squares indicate no available data passing our quality criteria.
