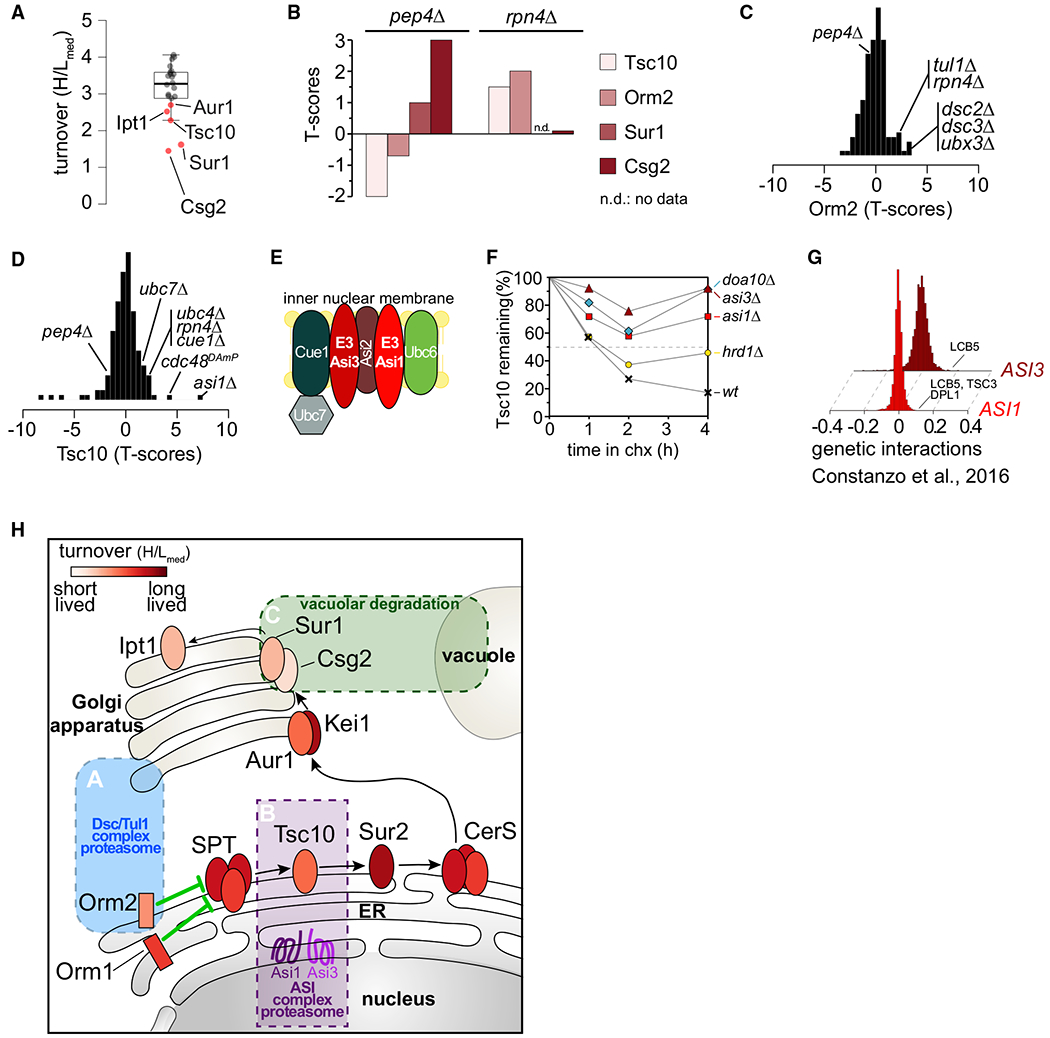
Figure 4. Spatial Control of Degradation for Key Enzymes in the De Novo Sphingolipid Biosynthesis Pathway.

(A) Boxplot showing the turnover (H/Lmed) distribution of enzymes in the de novo sphingolipid biosynthesis pathway. Red dots indicate significantly deviating sphingolipid metabolism enzymes.
(B) Stability of Tsc10, Sur1, Csg2, and Orm2 under proteasomal and vacuolar degradation inhibition.
(C) Stability scores of Orm2 in the mutants present in T-MAP.
(D) Stability scores of Tsc10 in the mutants present in T-MAP.
(E) Schematic of the ASI branch of ERAD in yeast.
(F) Degradation of GFP-TSC10 after inhibition of protein synthesis by cycloheximide in wild-type (WT), asi1Δ, asi3Δ, doa10Δ, and hrd1Δ. The graph shows the quantification of the western blot shown in Figure S3D.
(G) ASI1 and ASI3 genetically interact with genes involved in sphingolipid metabolism (Costanzo et al., 2016). Positive SGA scores represent positive genetic interactions.
(H) Model for spatial control of degradation of key enzymes in the de novo sphingolipid biosynthesis pathway by the Tul1 complex (blue box), ASI1/3 complex (purple box), and the vacuole (green box). Ellipses represent sphingolipid metabolic enzymes and are color coded according to their half-lives.
