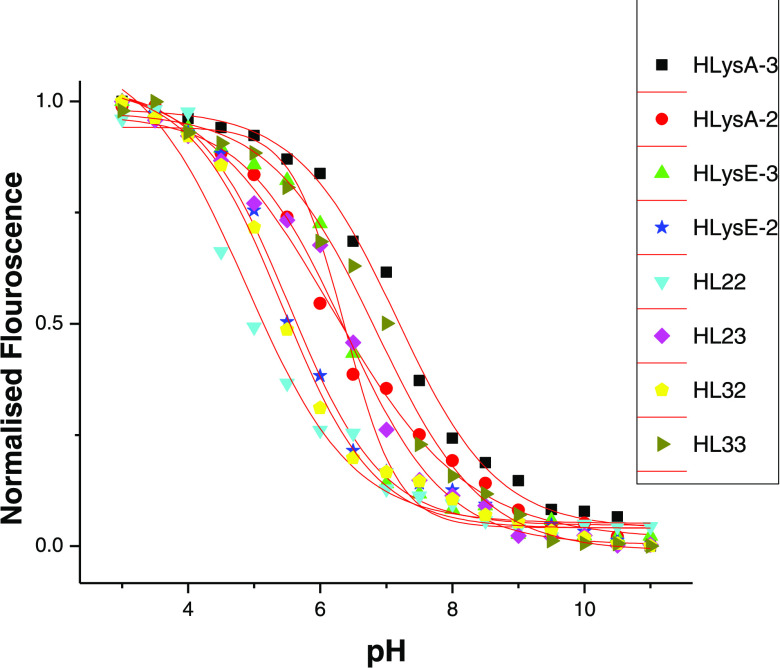
Figure 6.
Representative plot for all of the heterolipids showing normalized TNS fluorescence intensity as a function of pH in the presence of liposomes that consist of heterolipids/DSPC/cholesterol/PEG-lipid (40/10/40/10 mol %, respectively). The apparent pKa value of the amino lipid is the pH at which TNS fluorescence is half of its maximum and it was obtained after fitting the data with a sigmoid function.

