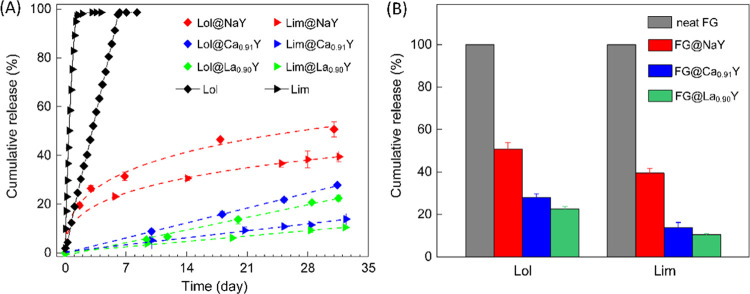
Figure 3.
(A) Time-elapsed release profiles of FG@NaY, FG@Ca0.91Y, and FG@La0.90Y in comparison to the corresponding free fragrances at ambient conditions (25 °C, ∼70% humidity). Dash lines represent the kinetic curves fitted by the Weibull function for FG@NaY (red) as well as by the zero-order kinetic equation for both FG@Ca0.91Y (blue) and FG@La0.90Y (green). (B) Cumulative release percentages of FG@NaY, FG@Ca0.91Y, and FG@La0.90Y over 30 days. For free limonene and linalool, the release time was two and three days, respectively. Data points represent mean ± standard deviation (SD) from triplicate samples, and error bars represent the standard deviation (n = 3).

