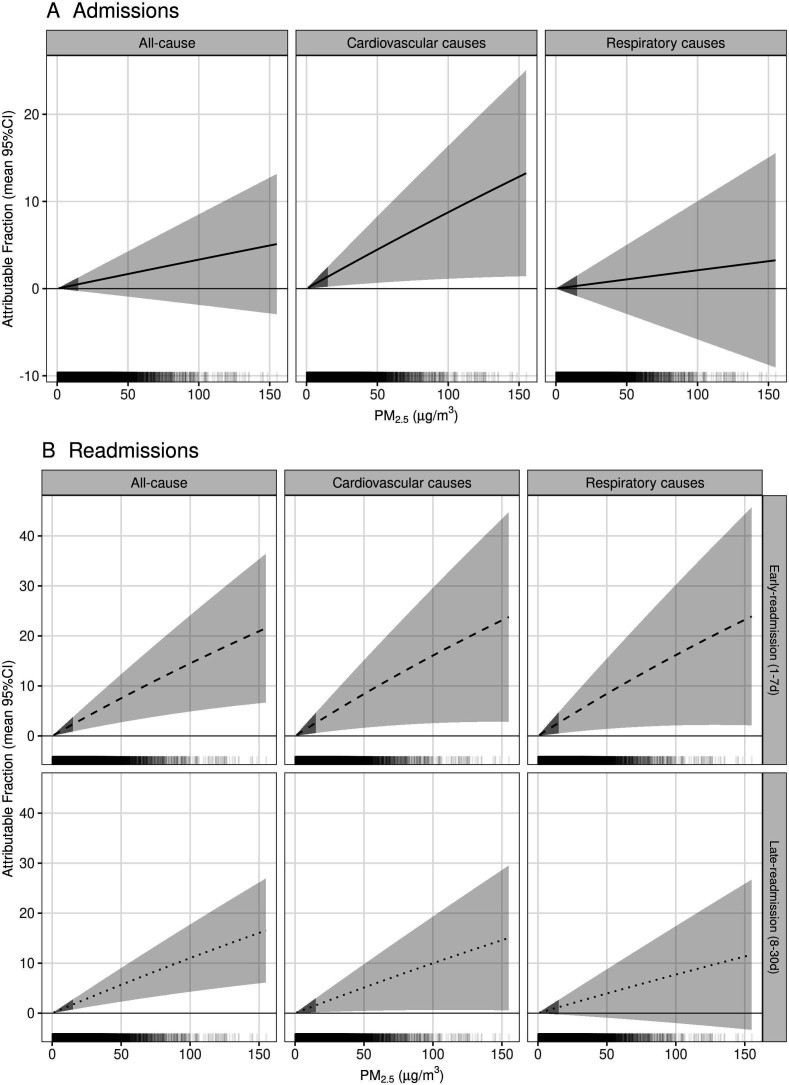
Figure 3.
Mean proportion (95% CI) of all-cause and cause-specific hospital admissions, early readmissions (1–7 days) and late readmissions (8–30 days) with respect to particulate matter (PM2.5) (µg/m3). Hash marks above the x-axis represent the density of daily county PM2.5. The 95% CI under 15.9 µg/m3 is shaded darker to indicate where 90% of the data falls.

