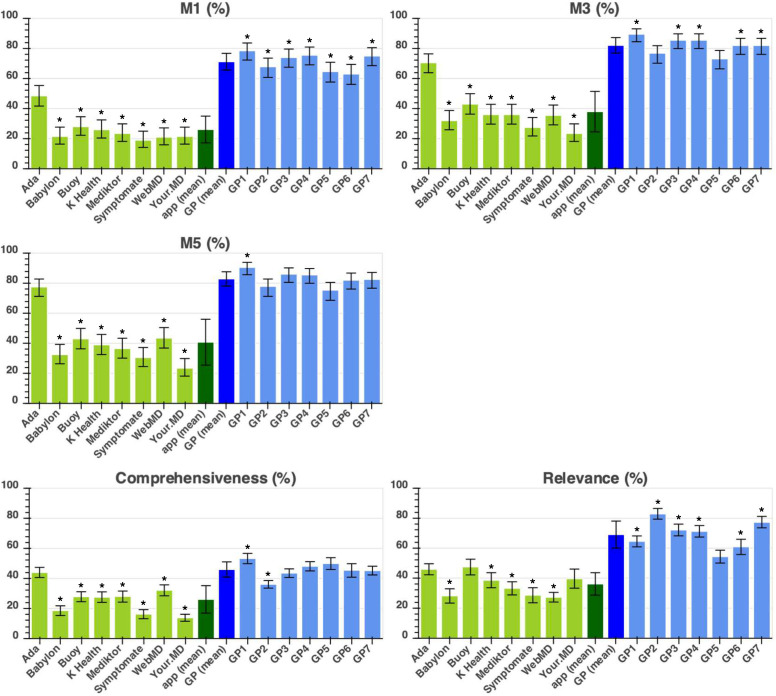
Figure 3.
Required answer approach showing the performance metrics (M1, M3, M5, comprehensiveness and relevance—as defined in table 2) of the eight apps and seven tested general practitioners (GPs). App performance is coloured in light green, average (mean) app performance is in dark green, average (mean) tested-GP performance in dark blue, and individual tested-GP performance in light blue. Statistical significance of the difference between the app with highest performance and all other apps/tested GPs is shown with the * symbol indicating: p<0.05. For one of these apps (Your.MD), one app-entry-Dr (#4) did not record all screenshots needed for source data verification—see online supplemental table 7 for a subanalysis of fully verified data, which shows the same trend of results and no significant difference to the data recorded here.

