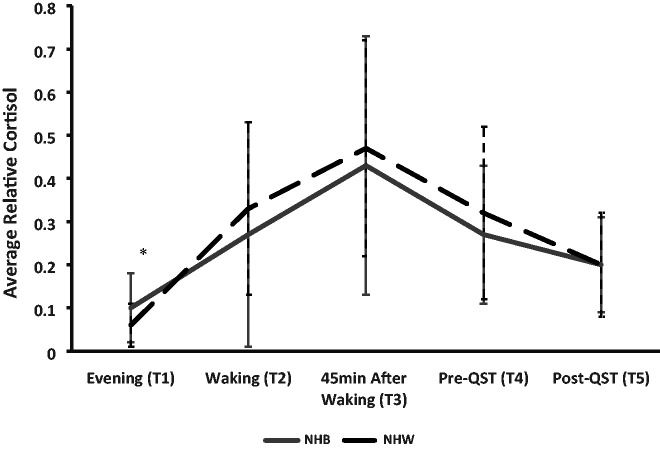
Figure 1.
12-hour cortisol pattern by ethnicity/race group over five time points. *Adjusted p<0.05; NHB= non-Hispanic Black; NHW= non-Hispanic White; QST= Quantitative Sensory Testing. Note: T1 = first collection; T2 = second collection; T3 = third collection; T4 = fourth collection; T5=fifth collection.

