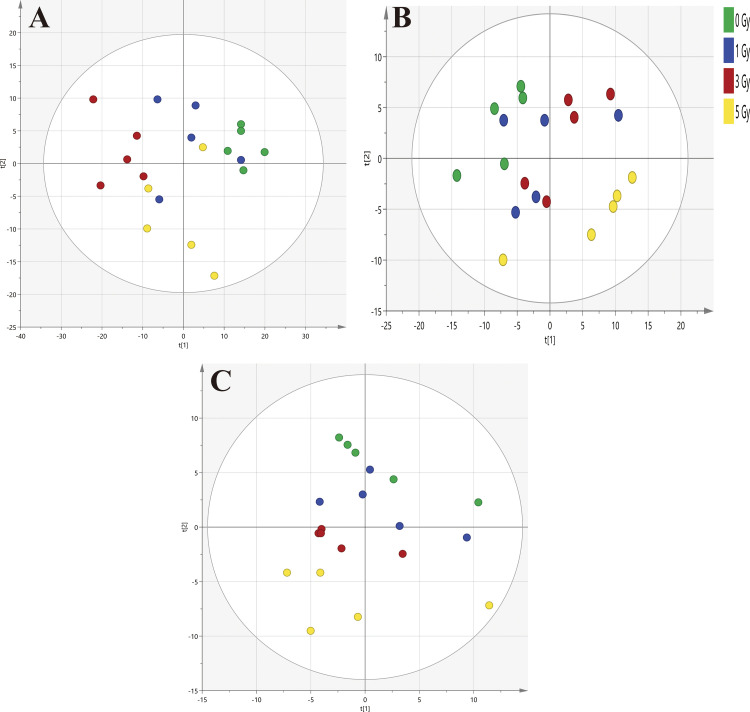
Figure 1.
Principal component analysis (PCA) score plots. PCA plots demonstrate the clusters of rat plasma samples after 0, 1, 3 and 5 Gy irradiation. Increased separation is evident among the irradiated groups with increased doses and clear separation is evident between 5 Gy and 0 Gy group. A, Reversed phase (ESI+) separation (R 2 X = 0.794, Q 2 = 0.643). B, Reversed phase (ESI−) separation (R 2 X = 0.702, Q 2 = 0.491). C, HILIC (ESI+) separation (R 2 X = 0.639, Q 2 = 0.363).

