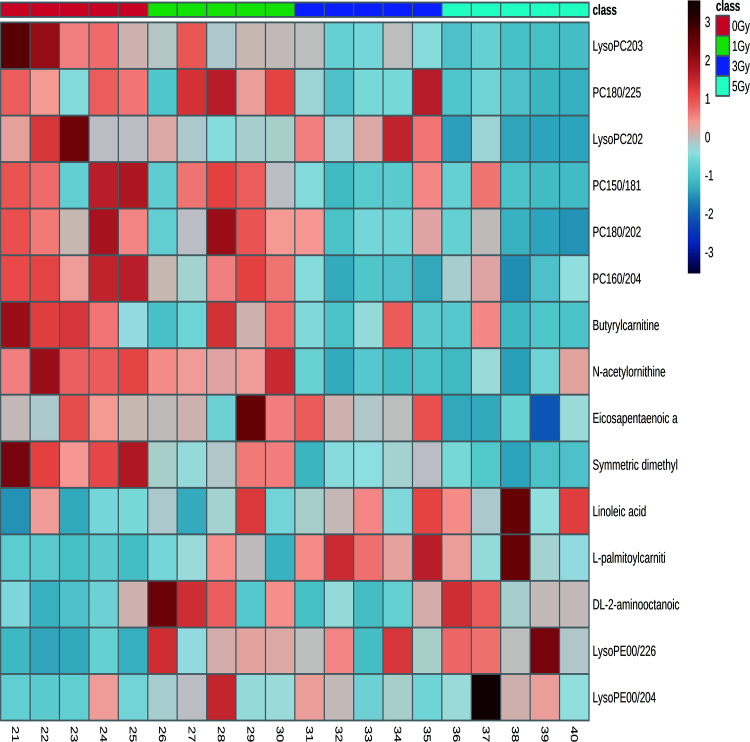
Figure 2.
Heatmap of the candidate radiation responsive metabolites in rat plasma after 0, 1, 3 and 5 Gy irradiation based on non-targeted metabolomics in the discovery stage. The heatmap shows the changes in the abundance of candidate metabolites after irradiation. Metabolites with P < 0.05 and VIP > 1 were selected, and different colors represented the relative concentration (red and blue colors represented high and low concentration, respectively). The conditions of heatmap were as follows: distance measure: pearson; clustering algorithm: ward; color contrast: default; data source: original data; standardization: autoscale features.

