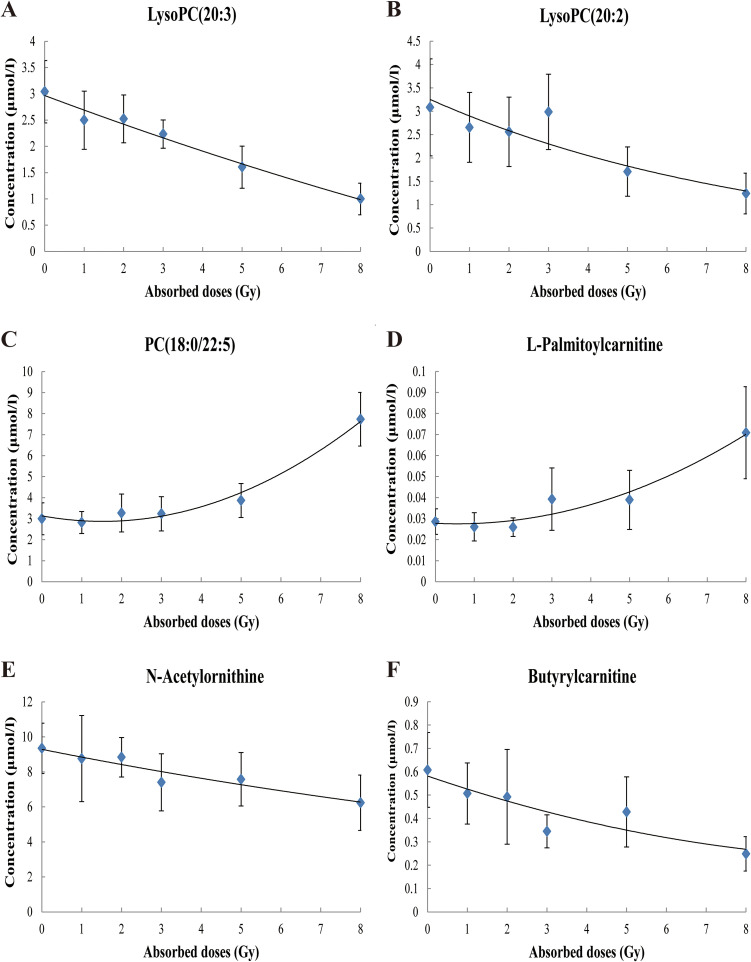
Figure 4.
Dose-response curves of the responsive metabolite concentration and the absorbed dose (0-8Gy) of cobalt-60 gamma rays. With the increased dose of 0-8 Gy cobalt-60 gamma rays, the concentrations of PC(18:0/22:5) and L-palmitoylcarnitine significantly increased, and the concentrations of LysoPC(20:2), LysoPC(20:3), N-acetylornithine and butyrylcarnitine significantly decreased. The dose–response relationship between the metabolite concentration and absorbed doses followed quadratic or exponential models. Panels A–F: Dose–response curves of LysoPC(20:3), LysoPC(20:2), PC(18:0/22:5), L-palmitoylcarnitine, N-acetylornithine and butyrylcarnitine.

