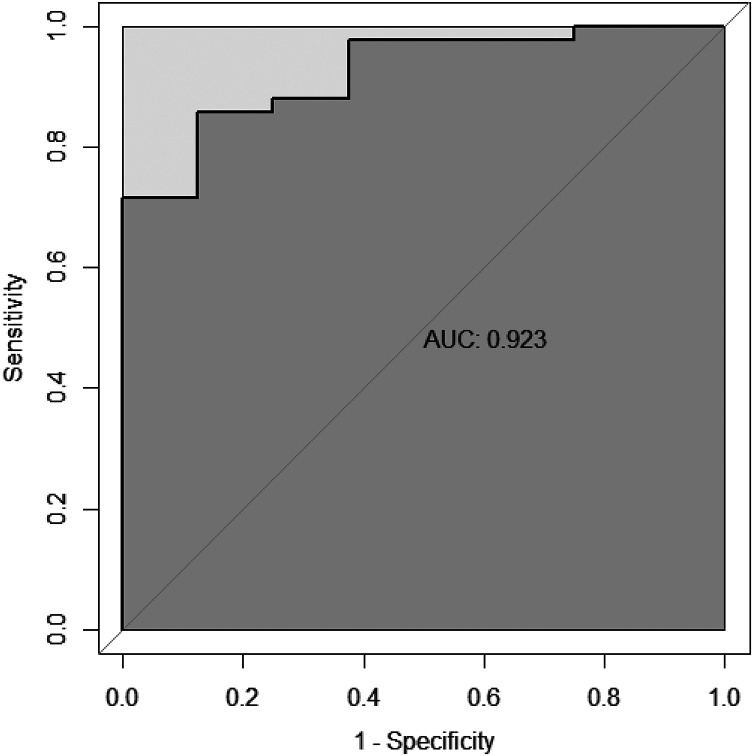
Figure 5.
ROC curve of the metabolite panel. The discriminatory ability between the exposed samples and controls were analyzed using the ROC curves in the verification stage. The metabolite panel included LysoPC(20:3), LysoPC(20:2), PC(18:0/22:5), L-palmitoylcarnitine, N-acetylornithine and butyrylcarnitine.

