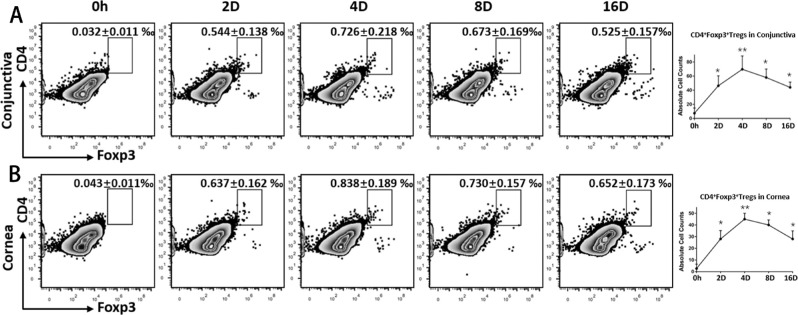
Figure 1.
Kinetic distribution of Tregs on the ocular surface after corneal alkali burn. Excised corneas and conjunctiva were harvested and made into single-cell suspension to analyze the distribution of Tregs at different time points after the corneal alkali burn. Zero-hour (0-h) data were derived from mice not injured by alkali. Representative flow cytometric dot plots show the frequencies of CD4+Foxp3+ Tregs on the ocular surface (conjunctiva (A) and cornea (B)) at different time points after the corneal alkali burn. The right panels show absolute Treg count in different tissues.

