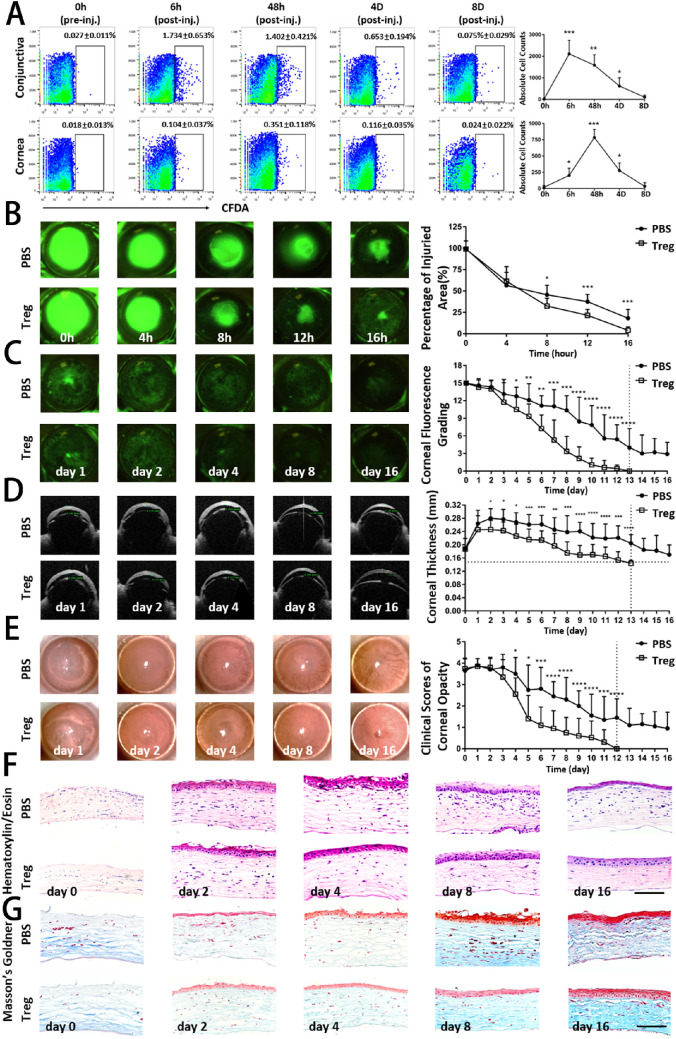
Figure 2.
Clinical examinations and histological analysis revealed an improved corneal restoration by treatment with subconjunctival injection of Tregs. (A) The CD4+CD25+ Treg cells were isolated and labeled with CFDA-SE. The 1 × 10⁵ Tregs/10 µL of PBS were injected subconjunctivally immediately after the corneal alkali burn. The control group was treated with 10 µL of PBS. The injured cornea and ipsilateral conjunctiva were digested and analyzed for labeled Tregs using flow cytometry. Representative flow cytometry dot plots show frequencies of Treg cells stained with CFDA at different time points after injection (pre-inj., pre-injection; post-inj, post-injection). (B) A 2-mm wound was made in the center of the cornea, and the healing process was visualized with fluorescein staining to highlight the denuded area. Representative images during the acute stage of corneal alkali burn injury (0–16 h) are shown. The percentage of corneal epithelial defective area in both groups at each time point was analyzed and summarized in the right panel. (C) Representative ocular surface fluorescein staining images of mice with corneal alkali burn during the latter recovery and reconstruction stage of injury (days 1–16) are shown. The corneal epitheliopathy evaluated by the National Eye Institute score in both groups at each time point was analyzed and summarized in the right panel. (D) Representative optical coherence tomography (OCT) images showed the corneal thickness at various time points. The horizontal dotted line shows the thickness of the corneas of normal mice. Corneal thickness measured by OCT are summarized in the right panel. (E) Representative bright-field corneal images showed corneal opacity at various time points. Clinical scores of corneal transparency are summarized in the right panel. (F) Representative hematoxylin and eosin staining images of alkali-injured corneas at serial time points in Treg-treated and PBS-treated groups are shown. Scar bar: 50 µm. (G) Representative Masson's Goldner (MG) staining images of normal and alkali-injured corneas are shown. Blue staining in the stroma represents collagen fibers, and red staining represents muscle fibers. Scar bar: 50 µm. Data shown represented three independent experiments. Statistical comparisons were made between the Tregs-treated and the PBS-treated groups at each individual time points.

