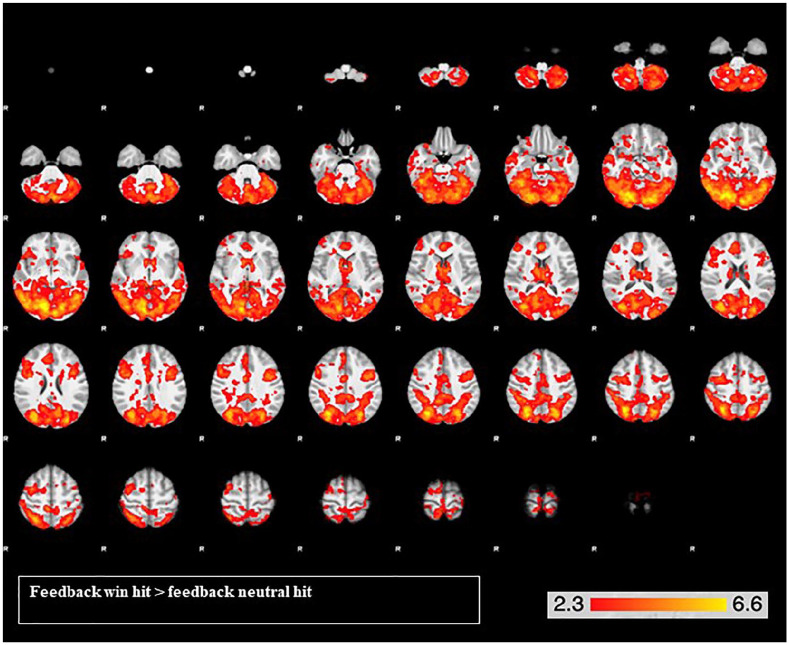
Figure 3.
Widespread brain activation for the reward feedback contrast across both drug conditions, with peak activations in the left occipital fusiform gyrus and the right precentral gyrus. From the top left, slice images progress upward, on a ventral-dorsal trajectory. The colours represent z values.

