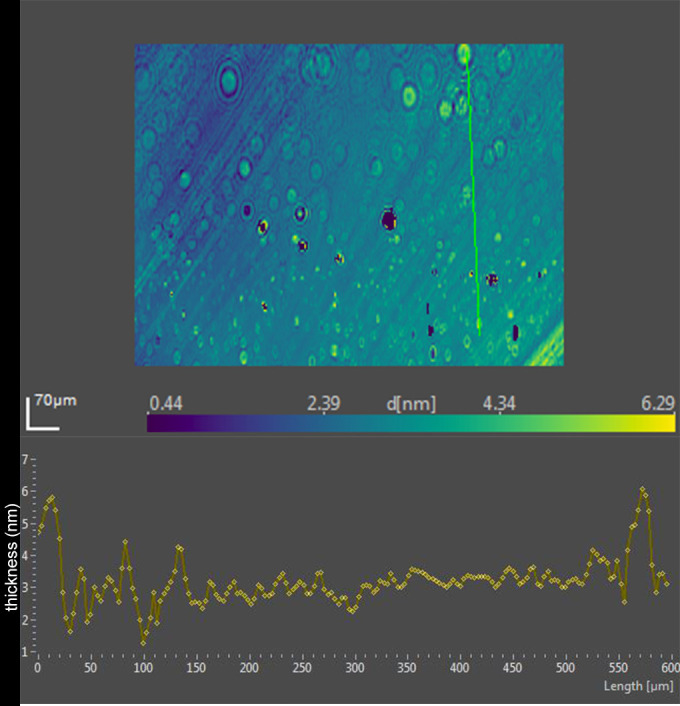
Figure 10.

Upper, ellipsometric image map of human tears (lot 3) prior to the addition of oleyl oleate. Thickness at each pixel, indicated as d [nm], is color coded. The x- and y-axis scales are shown in µm. Bottom, thickness profile corresponds to the green line in the map.
