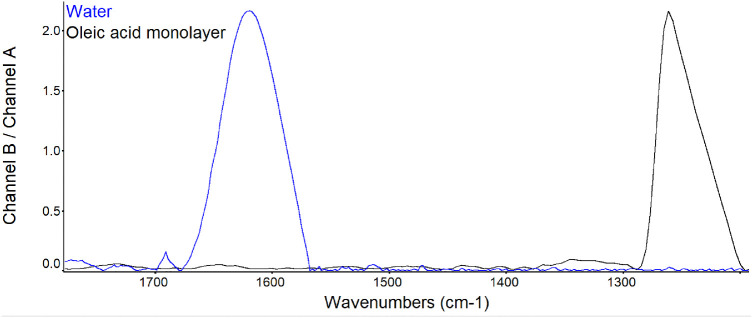
Figure 2.
PM-IRRAS spectra before and after an oleic acid monolayer film of 1.3 nm thickness was created on water. The spectra were averaged over 5000 scans. The band at 1660 cm−1 is assigned to OH stretch; the band at 1260 cm−1 is assigned to the alkyl groups of oleic acid. Full scale for each sample is shown. The y-axis shows the scale for water.

