Figure 4.

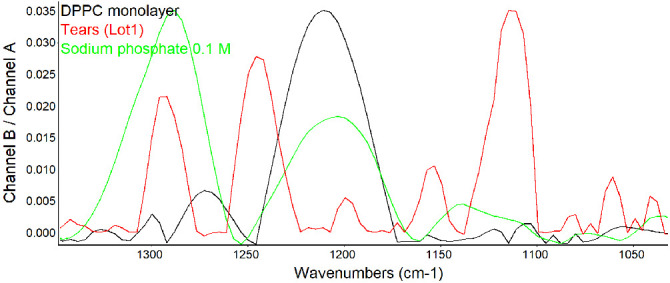
PM-IRRAS spectra in the fingerprint region for phosphate signals at the surface of human tears shown at full scale for each sample. The y-axis shows the scale for tears.

PM-IRRAS spectra in the fingerprint region for phosphate signals at the surface of human tears shown at full scale for each sample. The y-axis shows the scale for tears.