Figure 5.

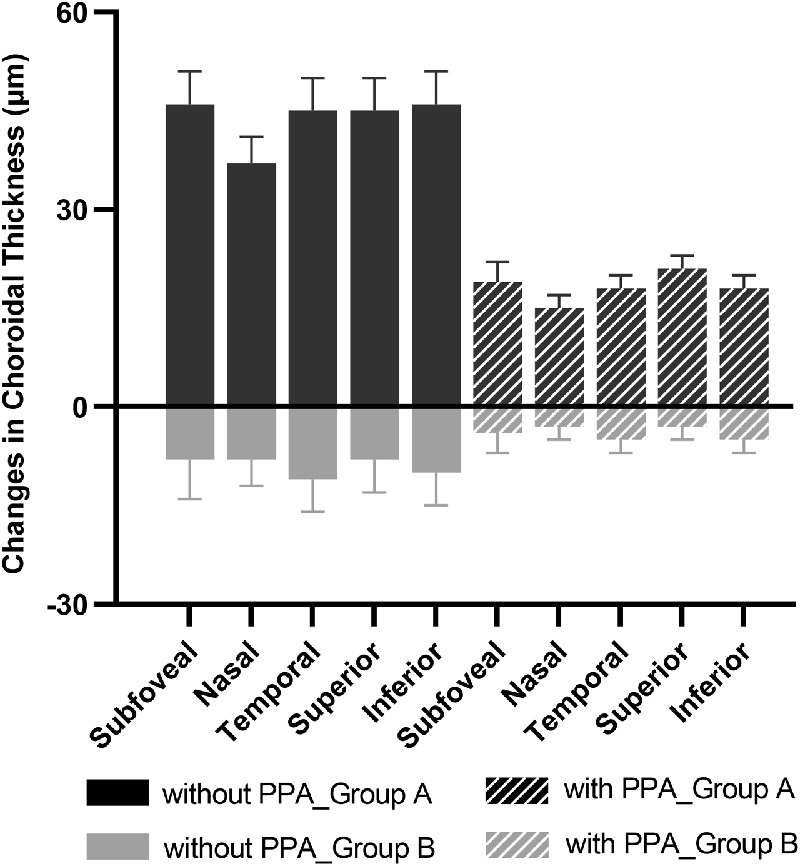
The changes in ChT over 6 months under the fovea and at four quadrants sectors stratified by the presence of PPA for two treatment groups.

The changes in ChT over 6 months under the fovea and at four quadrants sectors stratified by the presence of PPA for two treatment groups.