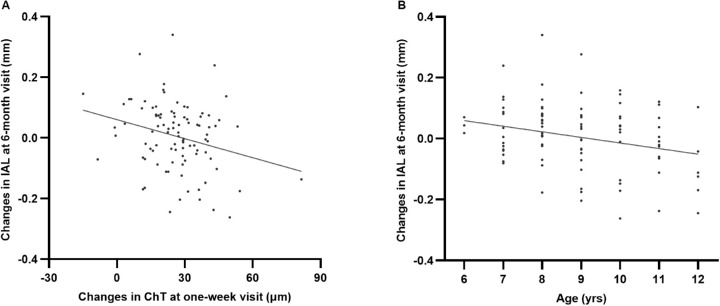
Figure 6.
(A) Scatter plots showing the changes in IAL over 6 months of treatment and the changes in ChT at the 1-week visit in group A (y = −0.002*x + 0.06; P = 0.01). (B) Scatter plots showing the changes in IAL over 6 months of treatment and baseline age in group A (y = −0.02*x + 0.17; P = 0.01).

