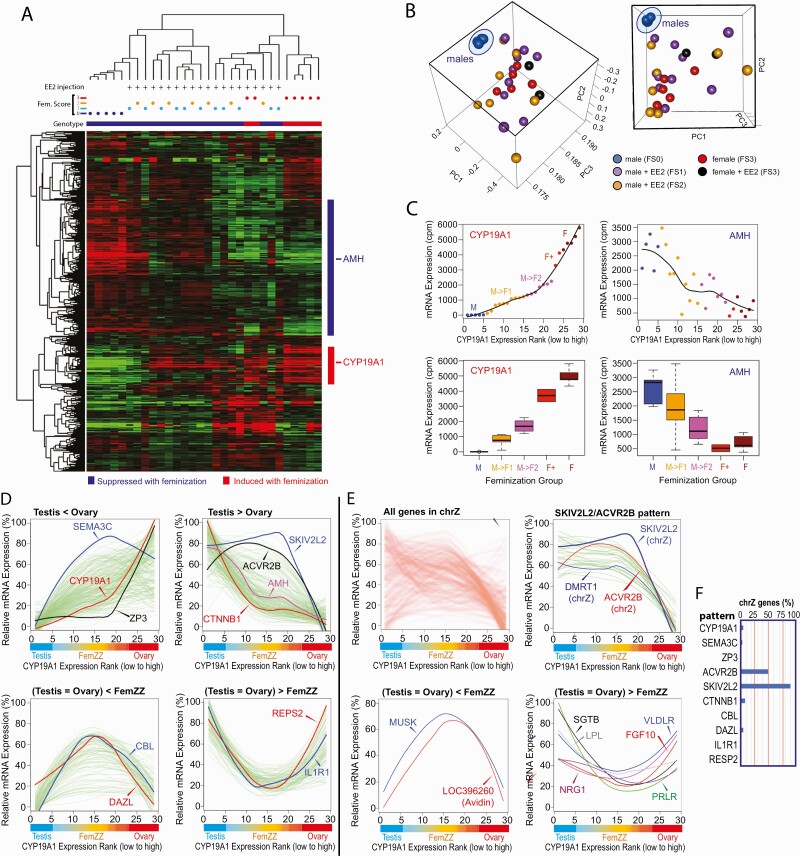
Figure 2.
Protein coding gene transcriptomes of chicken embryonic gonads at day 19 of incubation. A: Heatmap of unsupervised hierarchical clustering. Vertical columns represent individual embryos, and horizontal rows show genes. At the top, genetic sex (genotype; black = ZZ males, white = ZW females), feminization scores, and EE2 injection are indicated for each gonad. At the right, genes induced or suppressed by feminization are shown with red and blue bars, respectively, and locations of the representative ovarian (CYP19A1) and testicular (AMH) marker genes are indicated. B: Principal component analysis. Values at axes indicate coefficients of each principal component. Both cubes show the same PCA plot viewed from different angles. Dots indicate gonadal transcriptomes of FS0 normal males (blue), FS1 FemZZs (purple), FS2 FemZZs (orange), FS3 normal females (red), and FS3 females exposed to EE2 (black). Note that 5 independent ZZ-males exposed to control vehicle (DMSO) formed a very tight transcriptomic cluster (blue oval). C: Expression of CYP19A1 and AMH in gonads with varying degrees of feminization. Normalized mRNA expression is shown with smooth fitted lines (top panels) and boxplots (bottom panels). Dots and boxes are color-coded based on embryonic genetic sex, exposure, and CYP19A1 expression: M (blue), ZZ males exposed to DMSO; M->F1 (orange), ZZ males exposed to EE2, weak CYP19A1 expression; M->F2 (purple), ZZ males exposed to EE2, strong CYP19A1 expression; F+ (red), ZW females exposed to EE2; F (brown), ZW females, exposed to DMSO. D–F: Differential mRNA expression between testes, ovaries, and FemZZs. Gonads were sorted for expression of CYP19A1/aromatase mRNA (left-to-right direction of x-axis corresponds to low-to-high expression), and their associated morphological characteristics (testes, FemZZs, and ovaries) are indicated. Each green line indicates smoothed expression of a gene across gonadal samples. D: Whole-genome analysis. Representative 4 expression profiles are presented in separate panels—namely, expression in ovaries is stronger than in testes (top left), expression in testes is stronger than in ovaries (top right), expression in testes and ovaries is weaker than FemZZs (bottom left), and expression in testes and ovaries is stronger than FemZZs (bottom right). Expression profiles of representative genes are shown with colored lines. E: Analysis of genes in the sex chromosome Z. Heatmap of all chrZ genes showing the overall tendency of differential gene expression between testis, ovary, and FemZZs (top left). Whereas the majority of genes show ACVR2B-like profile (top right), several genes show CBL/DAZL-like profile (bottom left) or ILFR1/RESP2-like profile (bottom right). F: Incidence rates of genes located in the Z chromosome and following the indicated patterns of gene expression profiles. Abbreviation: chrZ, chromosome Z; DMSO, dimethyl sulfoxide; EE2, 17α-ethynylestradiol; mRNA, messenger ribonucleic acid; PCA, principal component analysis.

