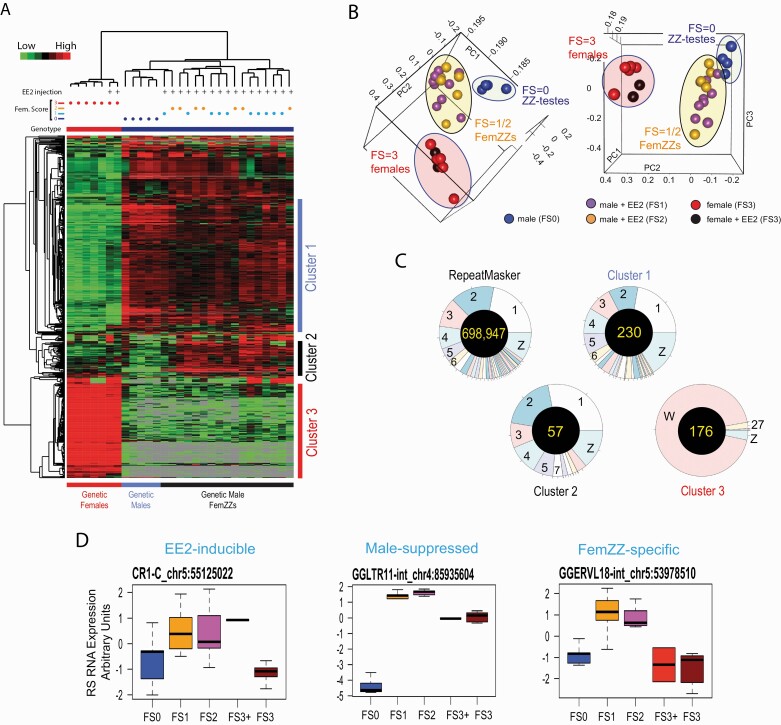
Figure 6.
RNA expression from RSs in day-19 chicken embryonic gonads. A: Heatmap of unsupervised hierarchical clustering of RNA expression from RSs determined by RNA-seq. Vertical columns represent individual embryos and horizontal rows show RSs registered in the galGal6 RepeatMasker file. At the top, genetic sex (genotype; blue = ZZ males, red = ZW females), feminization scores, and EE2 injection are indicated for each gonad. At the right, 3 clusters of the RSs showing representative expression profiles are indicated: Cluster 1, suppressed in genetic females; Cluster 2, suppressed in genetic males or females but expressed in FemZZs; Cluster 3, specifically expressed in genetic females. B: Principal component analysis. Ovals indicate ZW-ovaries (red), ZZ-testes (green), and FemZZs (yellow). C: Chromosomal distributions of expressed RSs. Pie charts show distributions of all RepeatMasker-registered chicken RSs, and the RSs belonging to Clusters 1, 2, and 3 shown in panel (A). Numbers of total RSs for each chart are shown at the center. D: Examples of RNA expression profiles from RSs. Boxplots show median, upper, and lower quartiles, and the highest and lowest values of normalized RNA expression of the indicated RSs in gonads with varying feminization scores (FS0–FS3); FS3+ are genetic female gonads with exposure to EE2. Abbreviations: CpG, 5’-C-phosphate-G-3’; EE2, 17α-ethynylestradiol; MBD-seq, methyl-CpG binding domain protein-enriched genome sequencing; RNA, ribonucleic acid; RNA-seq, ribonucleic acid sequencing; RSs, repetitive sequences.

