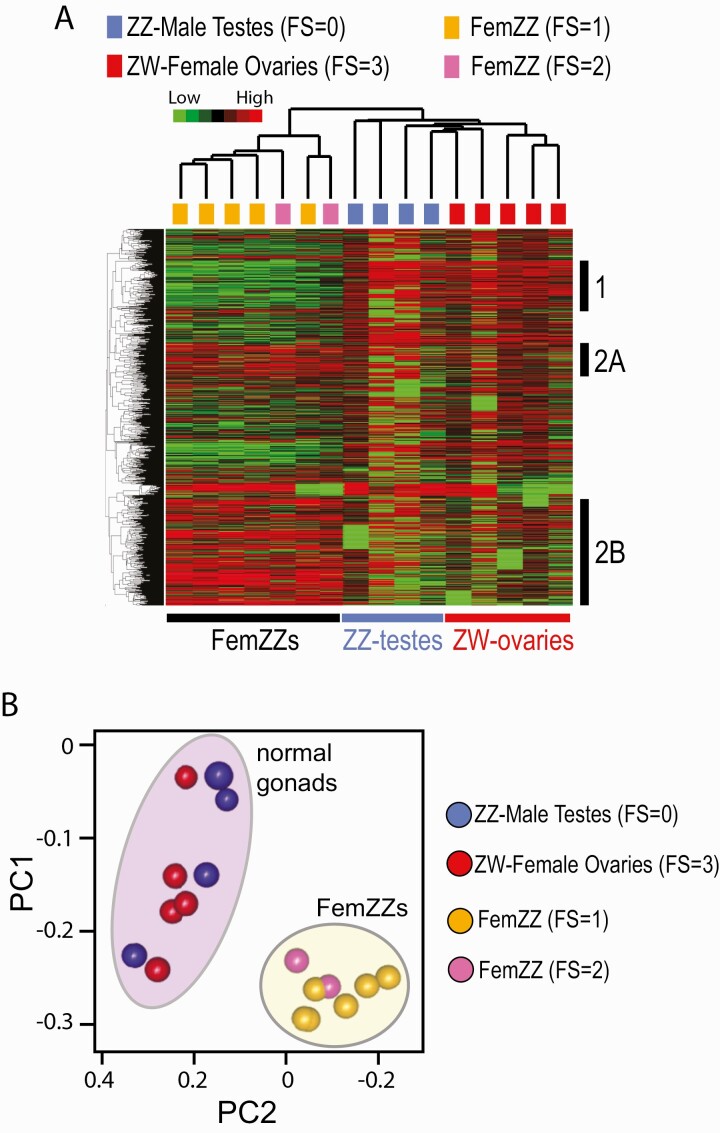
Figure 7.
MBD-seq CpG methylation profiles of day-19 chicken embryonic gonads. A: Heatmap of unsupervised hierarchical clustering of gonadal CpG methylation. Vertical columns represent individual embryos and horizontal rows show CpG sites differentially methylated across the feminization scores, which are indicated on the top with color codes. At the right, 3 clusters of CpG sites with representative methylation profiles are indicated: Cluster 1, hypomethylated in FemZZs; Clusters 2A and 2B, hypermethylated in FemZZs. B: Principal component analysis. Ovals indicate normal gonads (purple) or FemZZs (yellow).

