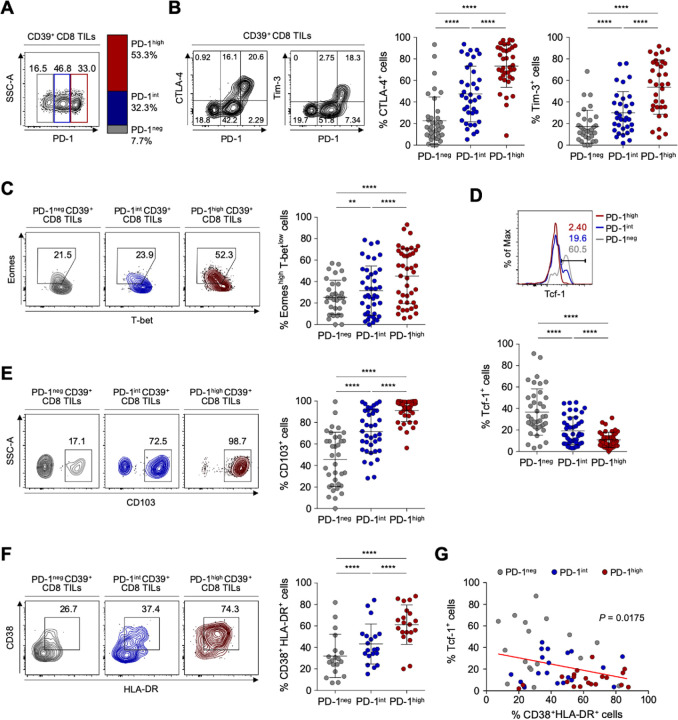
Figure 2.
Detailed immunological characterisation of CD39+ CD8 tumor-infiltrating lymphocytes (TILs) from the ovary according to programmed cell death protein 1 (PD-1) expression level. (A) CD39+ CD8 TILs were divided into three subpopulations based on PD-1 expression level. The left image is a representative flow cytometry contour plot, with the gray box indicating the subpopulation without PD-1 expression (PD-1neg), the blue box intermediate PD-1 expression (PD-1int) and the red box high PD-1 expression (PD-1high). The bar on the right shows the average percentages of the PD-1neg, PD-1int and PD-1high subpopulations among all patients. (B) Percentages of cytotoxic T-lymphocyte-associated protein 4 (CTLA-4)+ and Tim-3+ cells among CD39+ CD8 TILs according to the differential expression of PD-1. Contour plots on the left are representative plots. (C–F) Frequencies of Eomeshigh T-betlow (C), Tcf-1+ (D), CD103+ (E) and CD38+ HLA-DR+ (F) cells among subpopulations according to differential expression of PD-1. Left panel shows representative flow cytometry plots for each. (G) Correlation between the frequencies of Tcf-1+ cells and CD38+ HLA-DR+ cells among CD39+ CD8 TILs from the ovary. Graphs show the mean and SD. **P<0.01; ****p<0.0001.

