Figure 4.
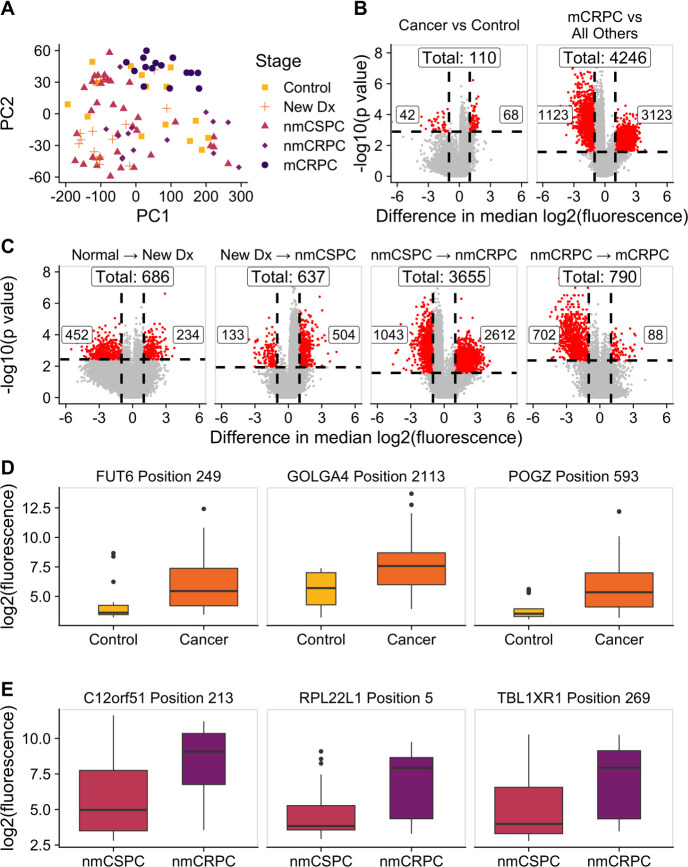
The composition of antibody targets changes with clinical stage of disease. (A) Principal component analysis plot obtained by using the set of 13 279 significantly changed peptides identified by the Kruskal-Wallis test then subtracting the grand mean of log2 fluorescence levels across patients for each peptide. Each point represents a patient, colored by clinical stage. (B) Volcano plots depicting peptides that met the 5% Benjamini-Hochberg (BH) false discovery rate (FDR) cut-off based on the Wilcoxon p values (horizontal lines) and had at least a twofold difference in median log2 fluorescence values between the stages being compared (vertical lines). The number of significantly increased peptides is shown on the right of each plot, the number of significantly decreased peptides is shown on the left, and the overall number of significantly changed peptides is shown at the top. Significant peptides are colored red. The left plot indicates peptides that had significantly different signals in patients with cancer compared with controls. The right plot indicates peptides that had significantly different signals in patients with mCRPC compared with all other groups. (C) Volcano plots indicating peptides that had significantly different signals between patients with consecutive clinical stages of disease. Box plots displaying fluorescence signals in (D) all patients with cancer compared with controls and (E) patients with nmCRPC compared with patients with nmCSPC in three example peptides that met both the twofold signal change and BH-adjusted p-value criteria. Box width is proportional to sample size. mCRPC, castration-resistant metastatic disease; nmCRPC, castration-resistant non-metastatic prostate cancer; nmCSPC, castration-sensitive non-metastatic prostate cancer.

