Figure 5.
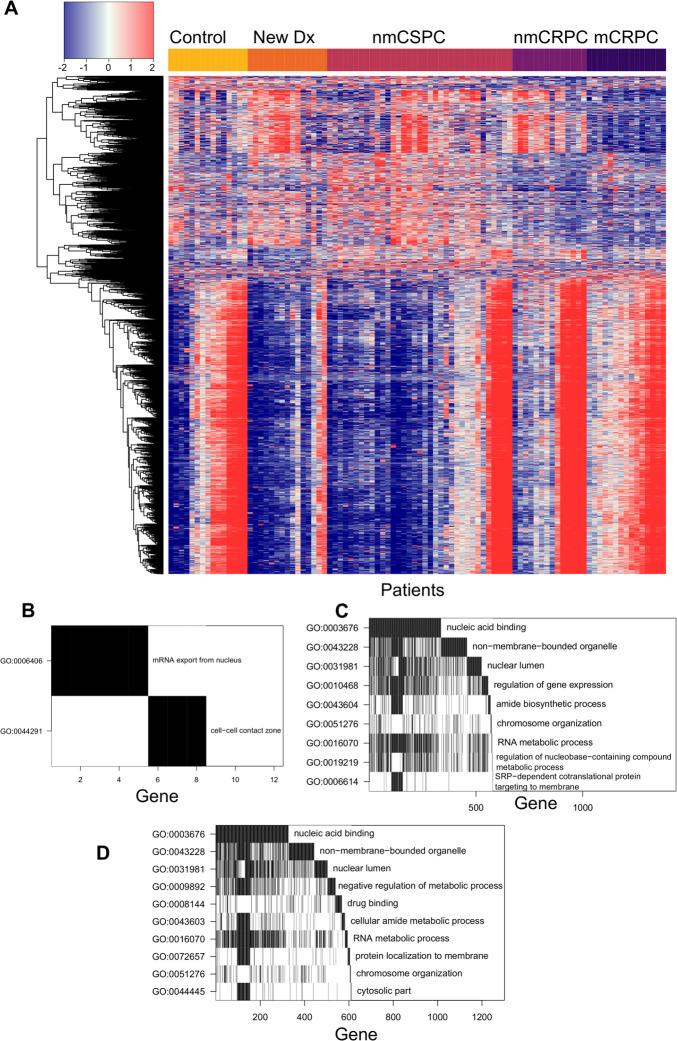
Specific proteins were preferentially recognized in patients with cancer and patients with mCRPC. (A) Heatmap depicting the difference in log2 fluorescence levels between each peptide in each patient and its grand mean across patients, displaying only the set of 6708 peptides that met the secondary selection criteria. Patients are grouped by stage across the x-axis, while peptides are clustered along the y-axis. (B) Waterfall plot depicting a gene ontology (GO) analysis of proteins that had significantly more antibody recognition in patients with cancer than controls. The top row indicates the GO term that encompasses the most genes corresponding to significant peptides. For the second row, these genes are then removed from the list and the GO term that encompasses the most genes in the remainder of the list is chosen. Genes identified by this process are counted along the x-axis to visualize overlapping GO terms. Waterfall plots depicting GO analysis of proteins that had significantly increased antibody responses in (C) patients with mCRPC compared with all other patients or (D) patients with nmCRPC compared with patients with nmCSPC. mCRPC, castration-resistant metastatic disease; nmCRPC, castration-resistant non-metastatic prostate cancer; nmCSPC, castration-sensitive non-metastatic prostate cancer.

