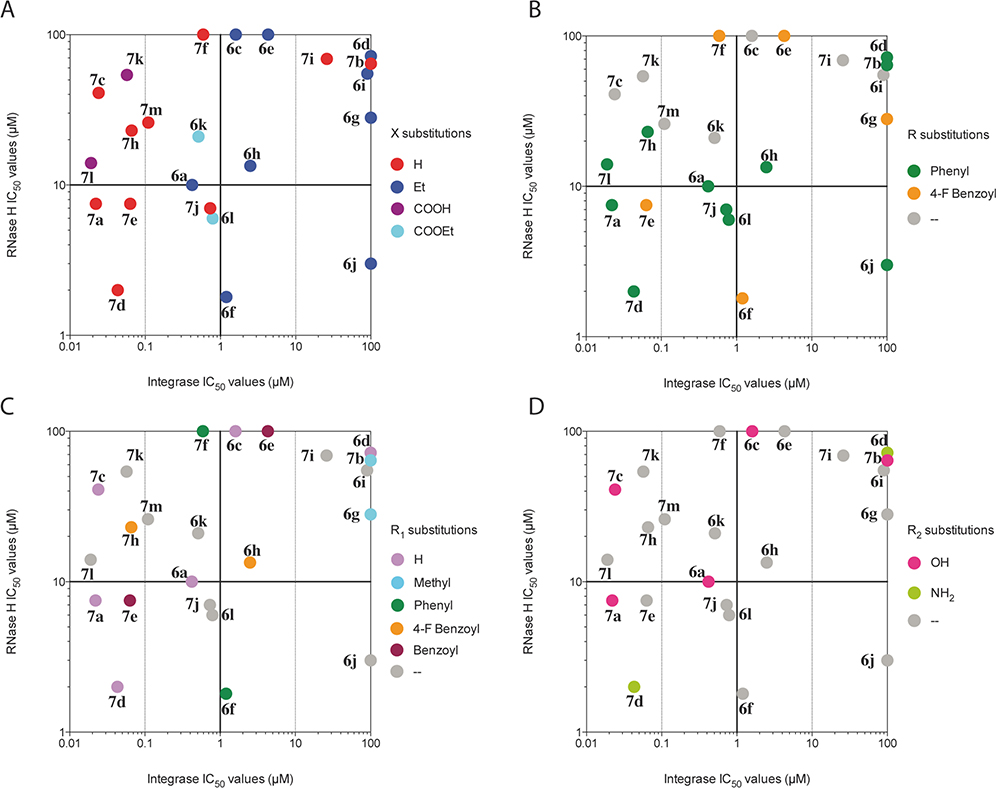
Figure 1.
Scatter plot for the inhibition of RNase H and IN enzymes. (A) Compounds are categorized according to their acidic or ester function. (B) Compounds are categorized according to the nature of their R substitution. (C) Compounds are categorized according to the nature of their R1 substitution. (D) Compounds are categorized according to the nature of their R2 substitution. Compounds with one IC50 value missing such as 6d have been left out of the plot, and compounds with IC50 values above 111 μM have been arbitrary positioned at the 100 μM value.

