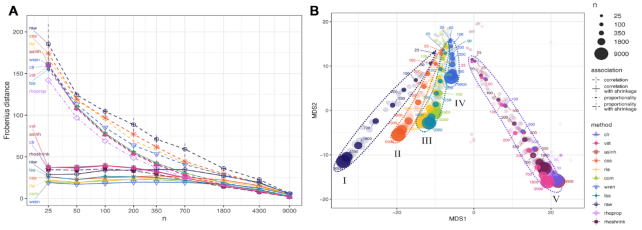
Figure 2.
Frobenius distance between estimates of association. (A) Average Frobenius distance between subsamples of the same sample size. Dashed lines represent the mean distance between normalized matrices after Pearson correlation. The solid lines represent the mean distance between normalized matrices where correlation/proportionality estimation with shrinkage was performed. The dot-dashed line represents rho, a proportionality metric. The long-dashed line represents rhoshrink, proportionality with shrinkage included. Vertical lines represent standard deviation from the mean for each corresponding method. (B) Multidimensional scaling (MDS) representation of Frobenius distance between correlation structures of varying sizes estimated from different normalization methods. The most opaque points represent the mean of five subsamples of the same size [color scheme as in (A)]. Points are labeled based on subsample size.

