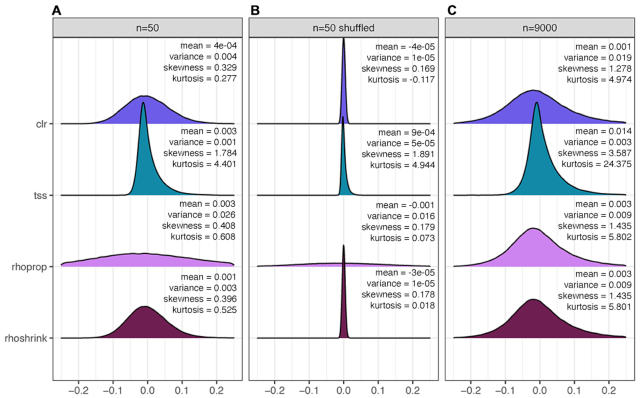
Figure 3.
Density of association values under different transformations and shrinkage. To represent clr and tss, data are normalized and correlation is calculated with shrinkage. Proportionality without shrinkage and proportionality with shrinkage are represented by rhoprop and rhoshrink, respectively. Each plot is a single random subsample of four representative methods at (A) 50 samples, (B) 50 samples with shuffled data and (C) 9000 samples. Mean, variance, skewness and kurtosis are shown for each distribution. Additional methods are provided in Supplementary Figure S3.

