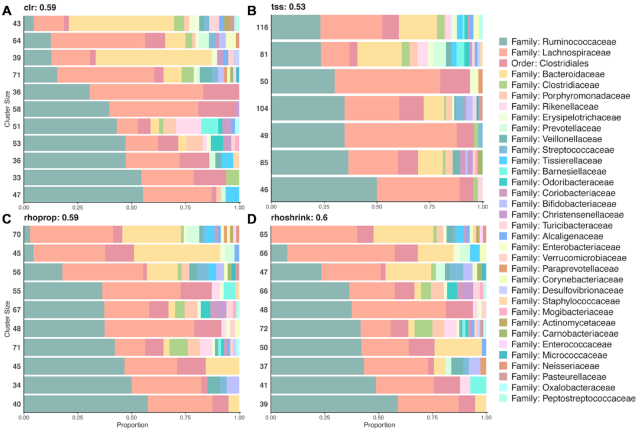
Figure 4.
OTU clusters from spectral clustering. (A–D) Each horizontal bar represents the composition of OTUs in a cluster at the family level. Clusters are in order of increasing percentage of the most abundant family: Ruminococcaceae. In each cluster, the colors represent the OTU families in each cluster. Numbers to the left of each bar represent the number of OTUs in each cluster. Values next to each method name represent cluster purity. Additional methods are provided in Supplementary Figure S7.

