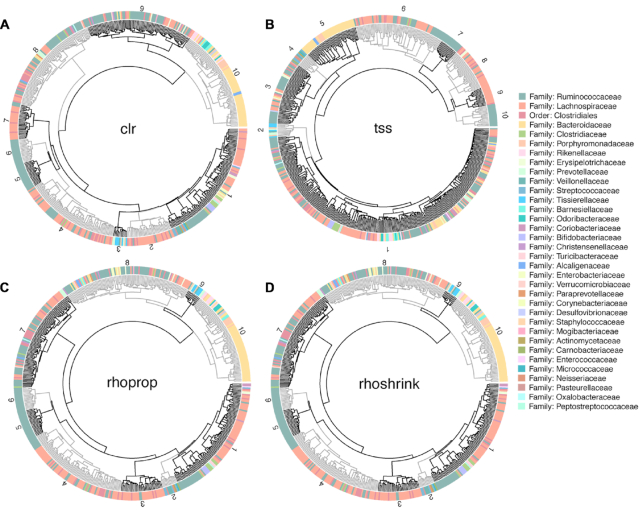
Figure 5.
Circular dendrograms showing hierarchical clustering patterns among OTUs. Each point surrounding the circular dendrogram represents one of the 531 OTUs in our dataset. The color represents family annotation. Each dendrogram (A–D) has been cut hierarchically into 10 trees (representing the 10 orders to which these taxonomic families map). The gray and black shading is used to highlight different clusters that are numbered. Hierarchical clustering of clr-transformed OTUs is better at delineating taxonomic relationships than clustering of those using tss; rhoprop and rhoshrink produce similar clustering patterns. Additional methods are provided in Supplementary Figure S8.

