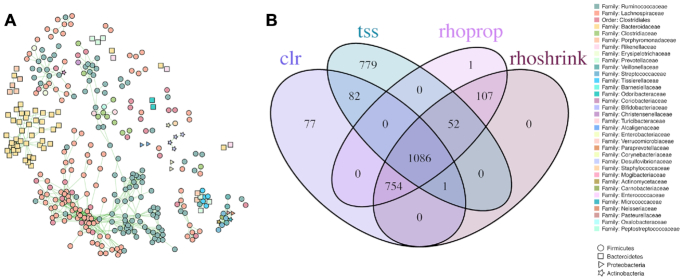
Figure 8.
Shared interactions between relevance networks. (A) Consensus network of edges in common between four representative methods. Network contains 1086 edges between 346 OTUs. Node color represents family annotation and node shape represents phylum. (B) Venn diagram showing unique and shared interactions predicted from representative normalization methods.

