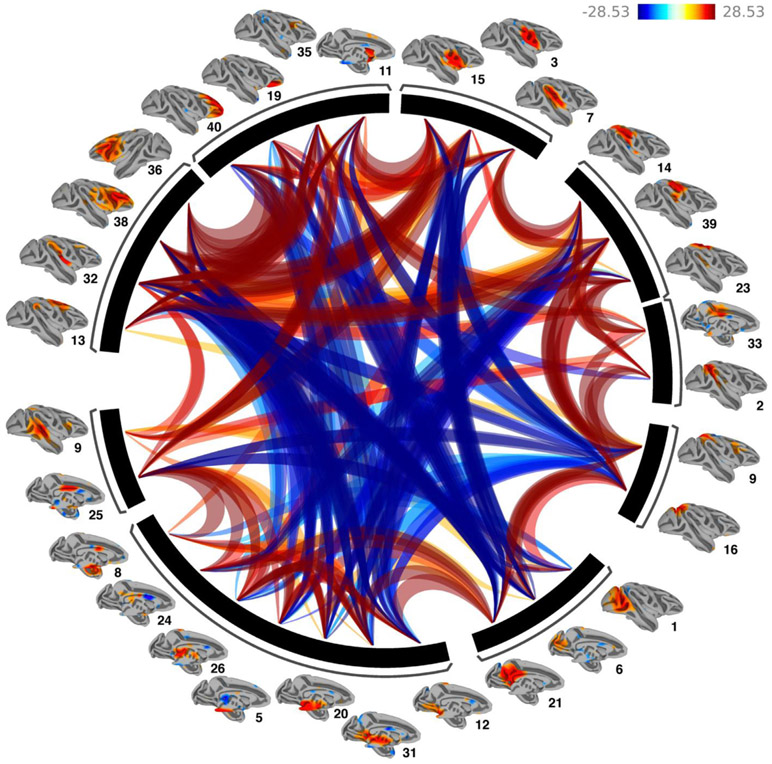
Fig. 6.
Functional Network Connectivity of the 30 extracted Independent components. Lines portray significant connections between the networks and color indicates positive (red) and negative (blue) functional connectivity. Networks were clustered using hierarchical clustering. Results demonstrate strong positive within cluster network connections and primarily negative between cluster connections.

