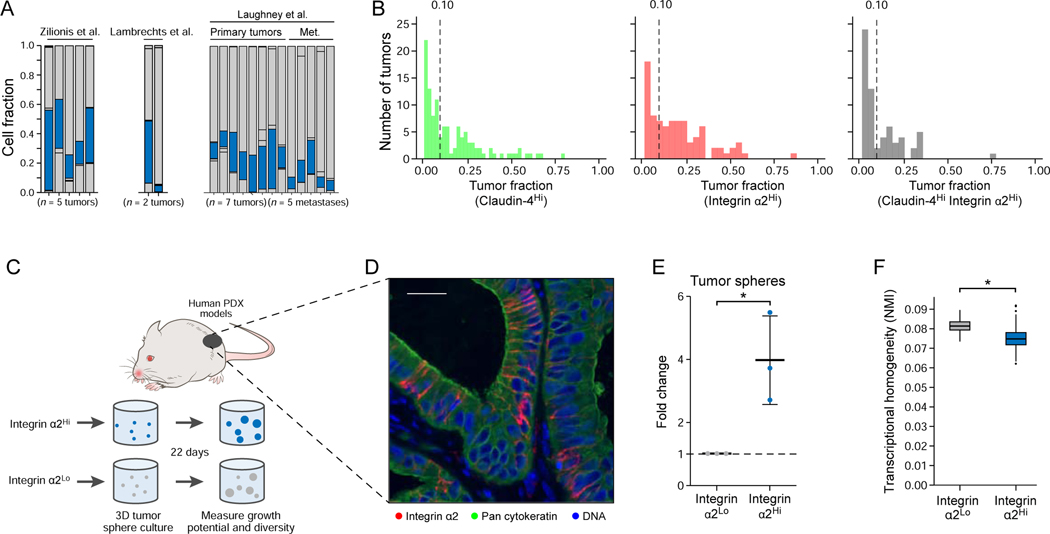
Figure 7. Integrin α2Hi LUAD HPCS cells isolated from human patient-derived xenografts harbor high growth potential and plasticity.
(A) Cells in the HPCS are present across all profiled tumors. Fraction of cells that were mappable (y axis) from each tumor (x axis) that express the HPCS-like program. (B) Histograms showing the distribution of the fraction of pan-cytokeratin positive cells in human LUAD tissues staining for: Claudin-4 (left), Integrin α2 (middle), and both together (right). Vertical dotted lines represent the point at which at least 10% of a tumor stained strongly positive. (C) Experimental design. Integrin α2Hi and integrin α2Lo LUAD cells were isolated from three distinct human patient-derived xenograft (PDX) models, followed by 3D tumor sphere culture for 22 days. (D) Pan-cytokeratin and integrin α2 immunofluorescence in one of the PDX models. Scale bar: 50 μm. (E) Fold change in growth (y axis) of tumor spheres derived from integrin α2Hi and integrin α2Lo cells. Data plotted as mean ± S.D. * p = 0.0216 (t test of the log2 transform of the shown fold change; n = 3 biological replicates) (F) NMI (y axis) between each population. Box plots: upper, median, lower quartile of 1,000 bootstrap samples, of 50 cells each, from the indicated time point; whiskers: 1.5 interquartile range. * p < 0.05 (STAR Methods). See also related Figure S6.

