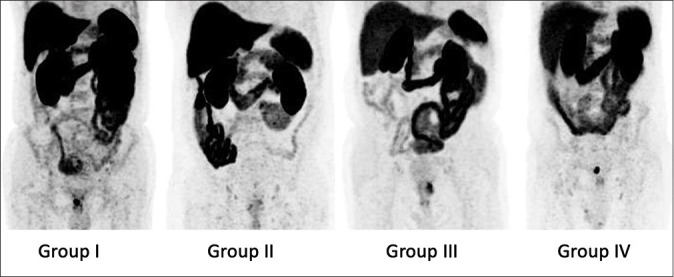
Figure 1.

Maximum intensity projections of fluorine-18 prostate-specific membrane antigen-1007 positron emission tomography of the abdomen in different patient groups showing comparable tracer levels in the liver and small bowel through all groups. Group I: not fasting; Group II: high caloric drink 1 h before injection; Group III: fasting for at least 6 h; Group IV: high caloric drink 1 h after injection. For example, local recurrent in the patient in Group IV can clearly be differentiated and is not affected by bowel activity
