
Figure 3.
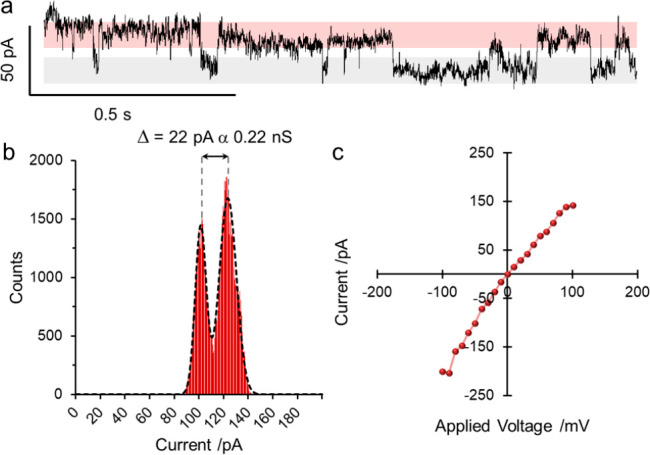
Single-channel planar bilayer measurements of ion channel formation by (FeII)6-coordinated Star of David catenane 3 (EYPC lipid/cholesterol (4:1, w/w), [3] = 8 μM, 1 M KCl, 20 mM MOPS, pH 7.4, 293 K). (a) Single-channel recording at +100 mV showing the opening (red) and closing (gray) of a single-ion channel. (b) All-points data analysis (see Section 4.3 of the Supporting Information) of the ion currents recorded at +100 mV. The data were fitted to two Gaussian distributions and the difference in ion current was measured. (c) Current–voltage curves showing the average ion current flow from +100 to −100 mV.