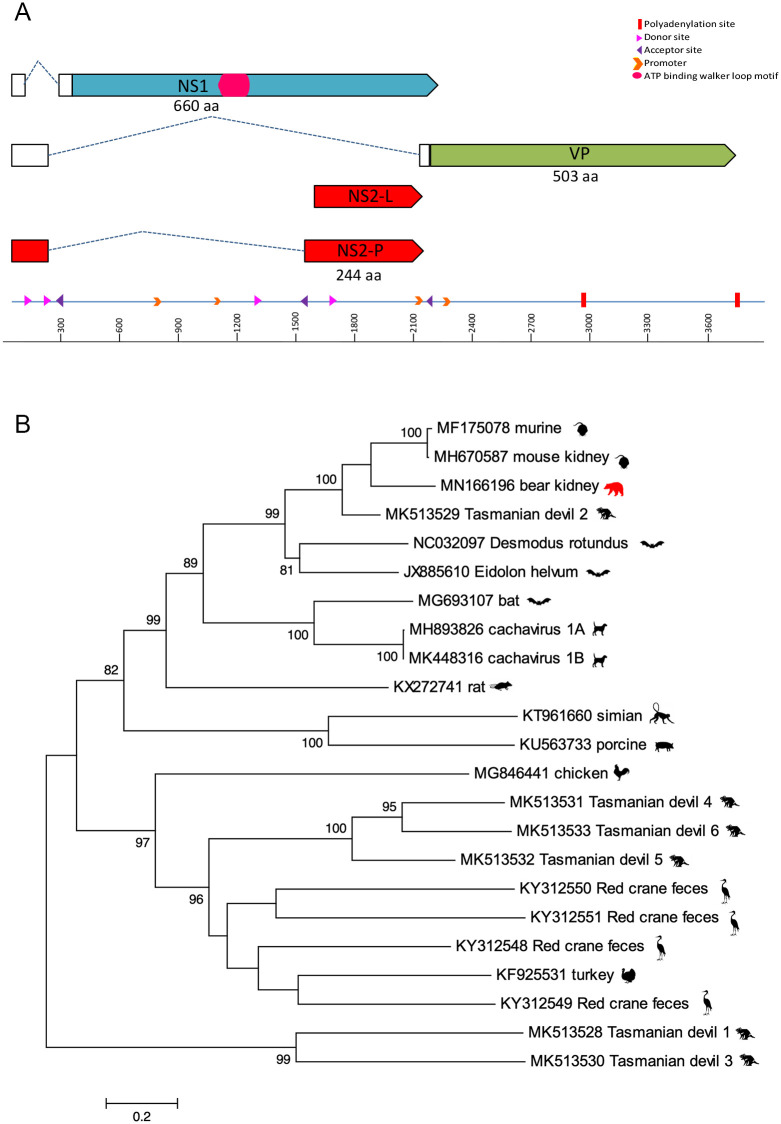
Fig 1.
A. The genome schematic of UaPV. Clear boxes represent untranslated regions, while the dashed lines represent splicing. The arrows represent ORFs. B. Maximum likelihood tree of NS1 aa chaphamaparvovirus sequences. Bar, 0.2 amino acid substitutions per site. Bootstrap values below 60 were removed.

