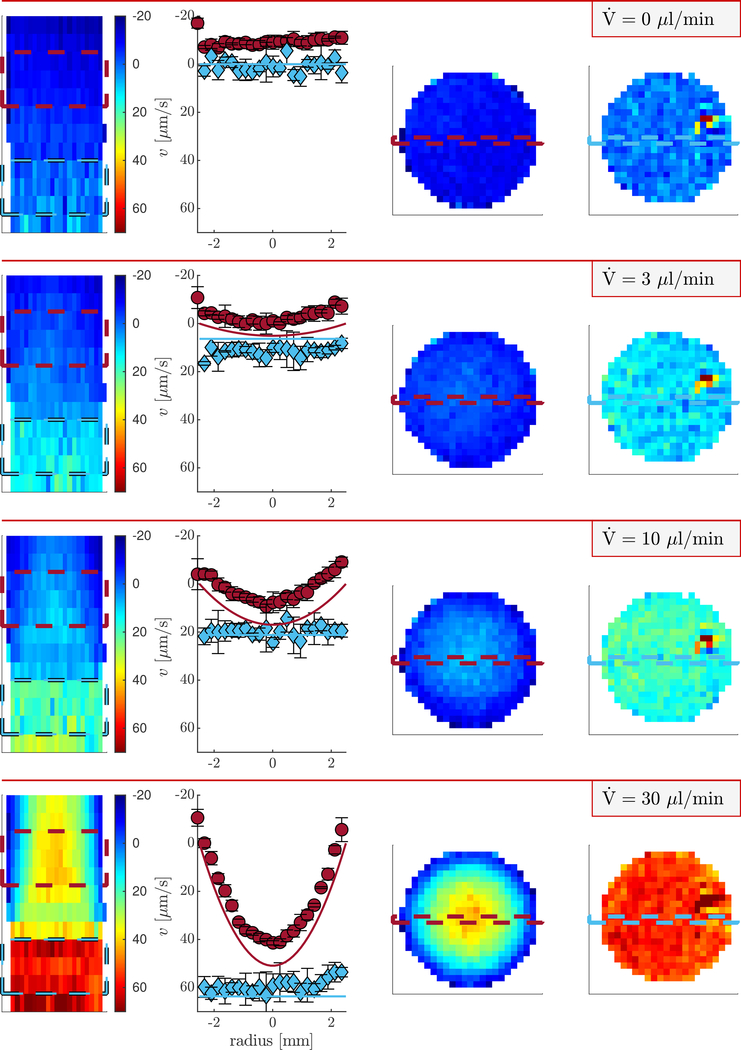
Figure 5: Velocity images and profiles of the beadpack flow phantom.
Heat maps of z velocity using q4 at variable flow rates. Columns 1, 3, and 4 show sagittal, axial bulk, and axial beadpack images respectively. Column 2 shows velocity profiles for the bulk region (red circles) and beadpack region (blue diamonds). The locations from which the profiles are taken are shown by the dashed lines in the axial images. Symbols and error bars are means and standard deviations of three rows of pixels shown by the dashed lines in the saggital image. Solid lines are theoretical velocity profiles for Poiseuille flow and plug flow using the known flow rate, porosity, and tube diameter.

