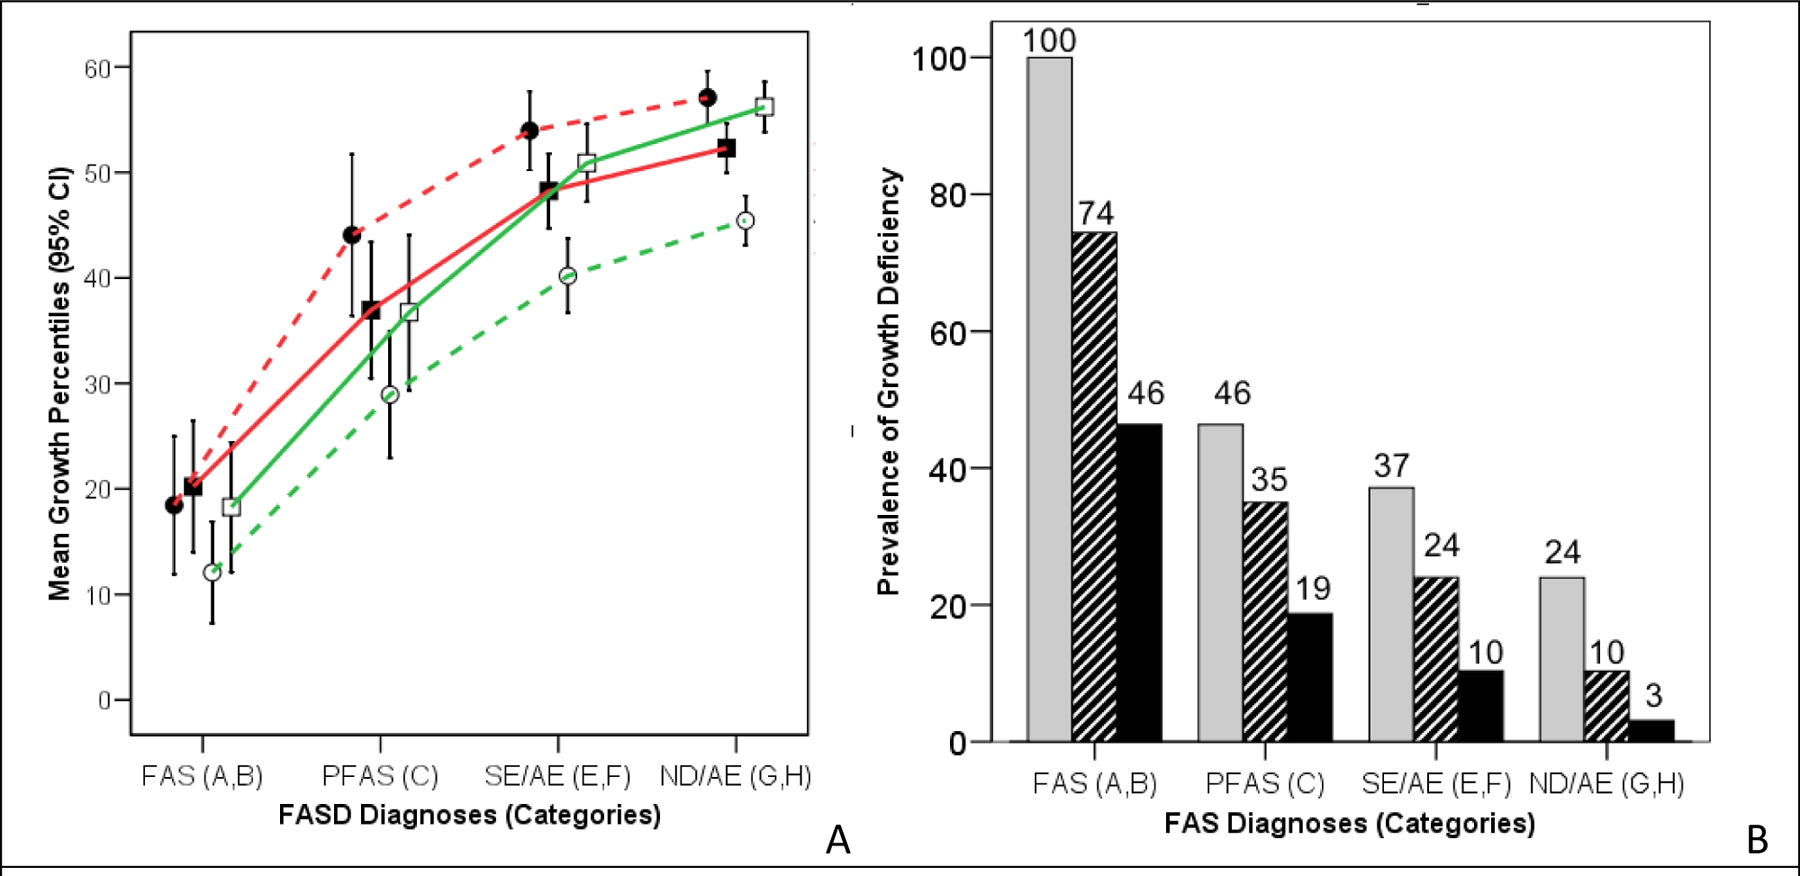
Figure 7.

The more severe the FASD diagnosis, the more prevalent and severe the growth deficiency
A) Growth deficiency occurs across the full spectrum of FASD diagnoses (FAS, PFAS, SE/AE and ND/AE). All measures of growth (height and weight percentiles at birth and at the age at diagnosis) decreased significantly with increasing severity of FASD diagnosis (one-way ANOVA linear terms: F = 78.8, 72.0, 111.5, and 120.1 respectively; all P = 0.000). B) Clinically, the prevalence of patients with Growth deficiency Ranks 2, 3 and/or 4 increased significantly with increasing severity of FASD diagnosis (Chi2 linear-by-linear = 179, P = 0.000). The gray bars reflect individuals with height or weight < the 10th percentile. Striped bars reflect individuals with height or weight < third percentile. The black bars reflect individuals with height and weight < third percentile. CI, confidence interval; PFAS, partial FAS; SE/AE, static encephalopathy/alcohol-exposed; ND/AE, neurobehavioral disorder/alcohol-exposed.
