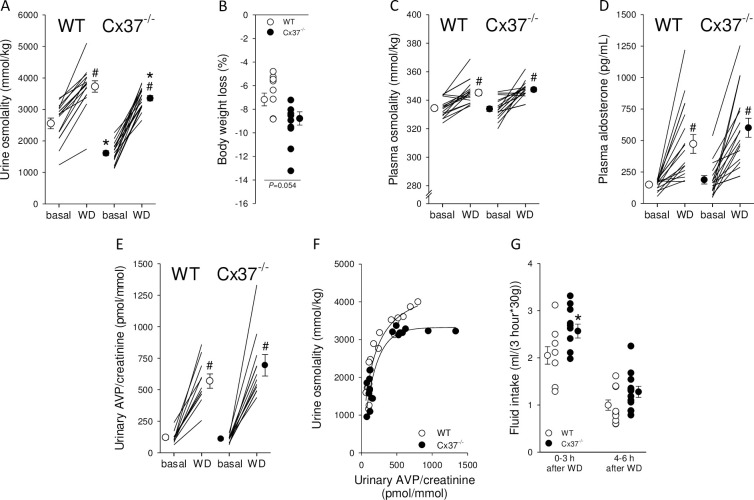
Fig 3. Water homeostasis in WT and Cx37-/- mice in response to 18-hour water deprivation (WD).
(A) WD significantly increased urine osmolality in Cx37-/- mice but not to the levels achieved in WT mice, remaining ~10% lower. (B) WD was associated with a tendency for greater loss in body weight. Increases in plasma osmolality (C) and plasma aldosterone (D) were not different between genotypes. (E) There was no difference between genotypes in urinary AVP/creatinine in response to WD compared to baseline. (F) Relationship between urine osmolality and urinary AVP/creatinine ratio between genotypes. Data under baseline conditions and after WD have been plotted. (G) Cx37-/- mice showed ~25% higher fluid intake in the 1st 3 hours after water was re-introduced and a tendency (~28%) for higher fluid intake from 4–6 hours. Data are expressed as mean ± SEM; n = 15–16 for urine osmolality, body weight and plasma osmolality, n = 10–12 for fluid intake and AVP. Data were analyzed by unpaired and paired Student’s t-test, *P<0.05 versus WT.

