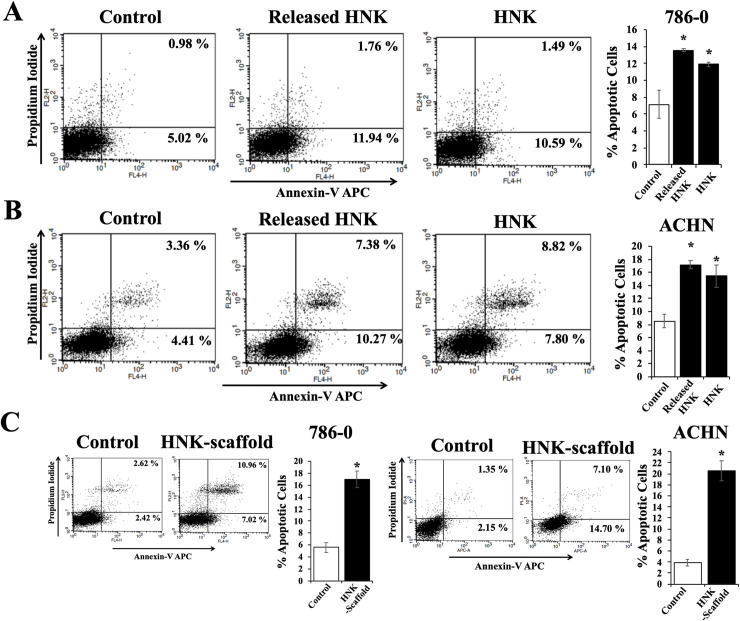
Fig 3. Apoptosis-inducing activity of Honokiol released from Honokiol-loaded PLGA 85–15 scaffold.
(A) and (B) Renal cancer cells (786–0 and ACHN respectively) were treated with either the released Honokiol (20 μM) or Honokiol (20 μM) along with control for 24 hr. Following treatment, cells were stained with Annexin-V-APC and propidium iodide and the apoptotic indices were analyzed by flow cytometry. (C) Similarly, apoptotic indices of 786–0 and ACHN cells cultured with either 0.5x0.5 cm2 Honokiol-loaded PLGA 85–15 scaffold or control scaffold for 24 hr were analyzed. The bar graph presented next to the flow cytometry dot-plots represents the percentage of total apoptotic cells (early + late). A, B, and C results shown are representative of three independent experiments. The columns in the bar graphs represent the mean ± S.D. of experimental readings. *, represents p<0.05 compared with respective controls.

