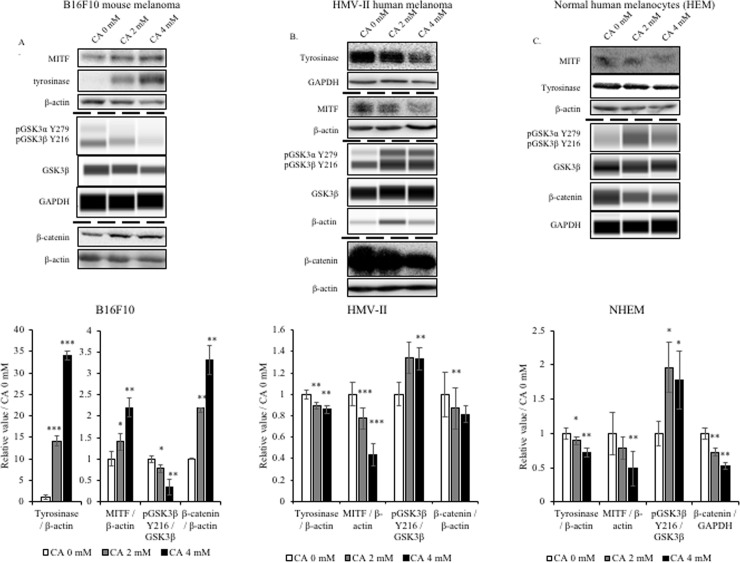
Fig 4. Effect of citric acid on the tyrosinase, MITF, and β-catenin protein levels in B16F10, HMV-II, and HEM cells.
After treatment with citric acid (CA) (4 days for B16F10 and 6 days for HMV-II and HEM), cells were collected, and western blotting was performed to determine the expression of tyrosinase, MITF, and β-catenin in all three cell lines. (A, B, C) Protein levels detected using western blot analysis. Bar graphs represent the quantification of the western blot signals, analyzed using Image J. Results are presented as mean ± SD. Statistical analysis was performed using the Student’s t-test versus the non-treated groups (0 mM), n ≥ 3, *P < 0.05;**P < 0.01; ***P < 0.001.

