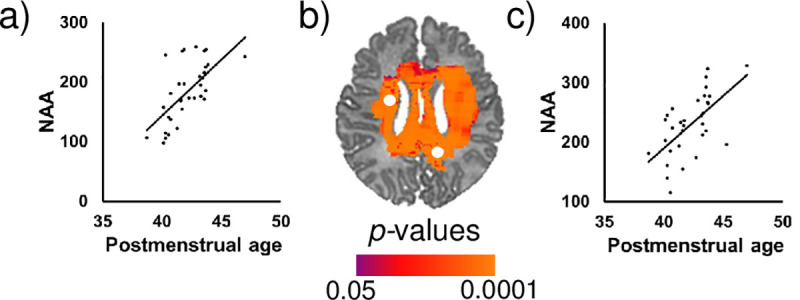
Fig 4.

Postmenstrual age at scan (in weeks) was significantly positively associated with NAA concentrations in the (a) left caudate and (c) right superior longitudinal fasciculus after controlling for sex. FDR-corrected p-values are shown in the color bar. Metabolite data in the scatterplots were sampled from the regions indicated by the white dots (b). NAA is shown in arbitrary units (a.u.).
