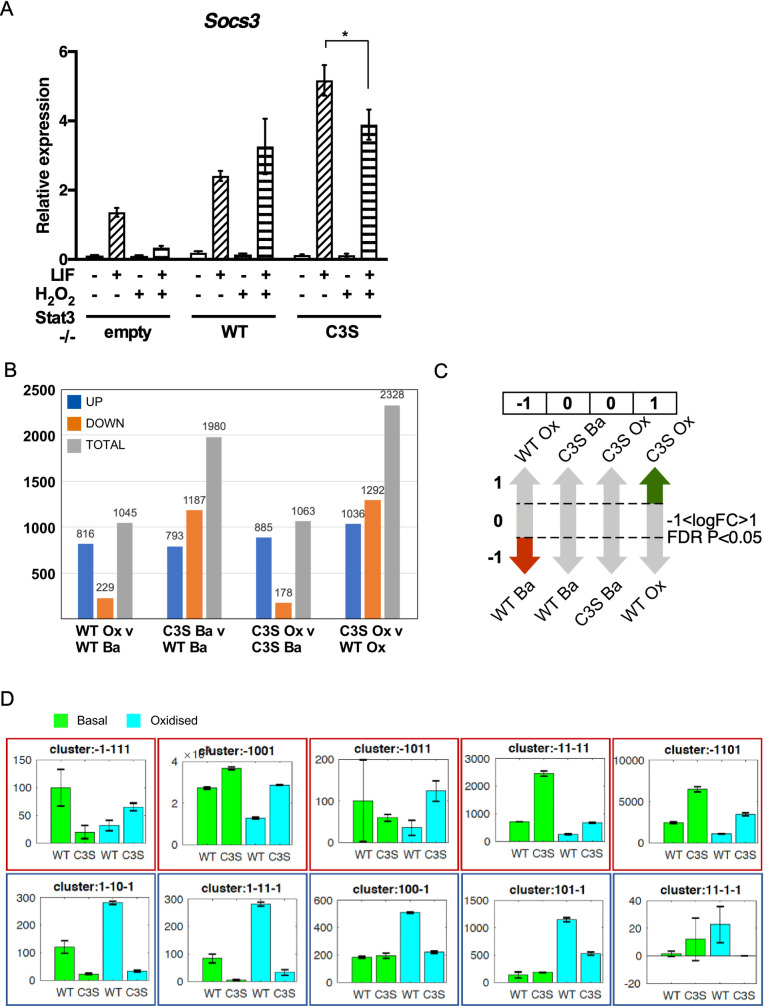
Fig 2. Differential -/-WT and -/-C3S expression profiling reveals genes acutely responsive to Stat3 oxidation.
A) RNA isolated from MEFs untreated (-), treated with 10 ng ml-1 LIF for 30 mins and/or 100 μM H2O2 for 1 h (+) was enriched for mRNA and analysed for Socs3 and Hbs1l expression by qRT-PCR. Socs3 expression was normalised to Hbs1l. Data are expressed as mean ± SEM, n = 3. B) Bar graph showing number of differentially regulated genes per comparison. C) Rationale for discretisation of DE genes from four-way comparison into clusters characterised by distinct multivariate expression patterns. Significant DE in each comparison (e.g. -/-WT basal v oxidation) scores 1 (increase), -1 (decrease) or 0 (no significant change). Diagram indicates DE pattern characteristic for cluster -1,0,0,1. D) Bar graphs showing a random example for each of 10 unique patterns identified from 3617 differentially expressed genes. Y-axes show normalised counts. Blue and red outlines indicate Stat3 oxidation-responsive gene expression significantly up- or down-regulated, respectively, in control v oxidation -/-WT cells and dis-regulation in -/-C3S cells.

