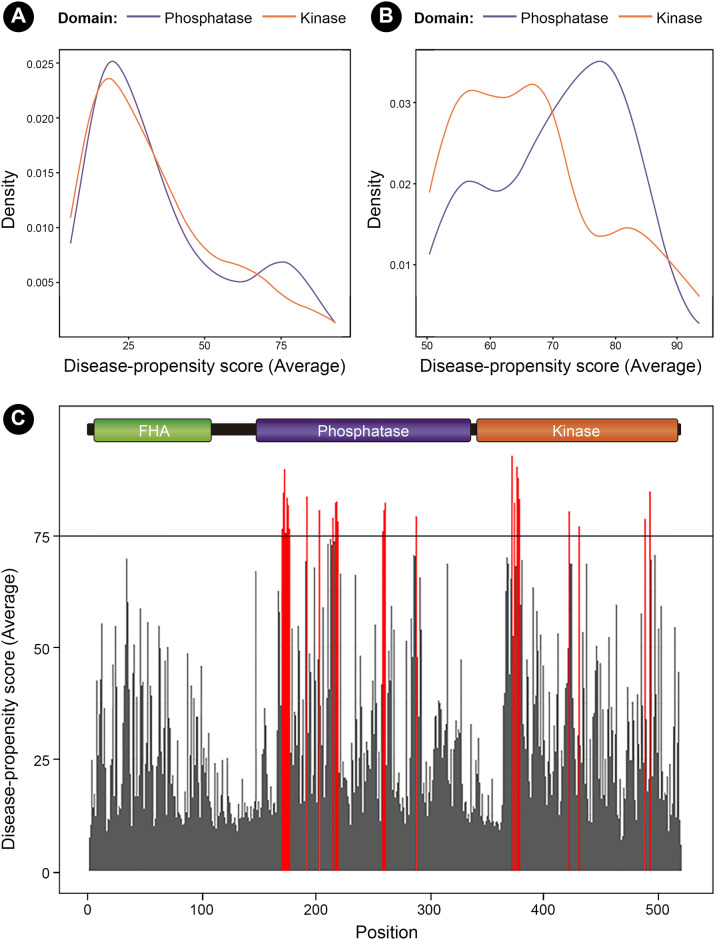
Fig 5. Disease-propensity plots of PNKP.
A) Distribution of the average Disease-Propensity scores for the amino acids within the phosphatase and kinase domain of PNKP. Notice that there is a higher number of residues showing DPS > 75 in the phosphatase domain. B) The differences between average DPS is more evident when only DPS > 50 are considered. C) DPS for the entire protein, showing several hotspots in the phosphatase domain. All regions with an average beyond the critical value of 75 are colored in red, but only consecutive positions with averages over the critical value are considered disease-propensity hotspots.

