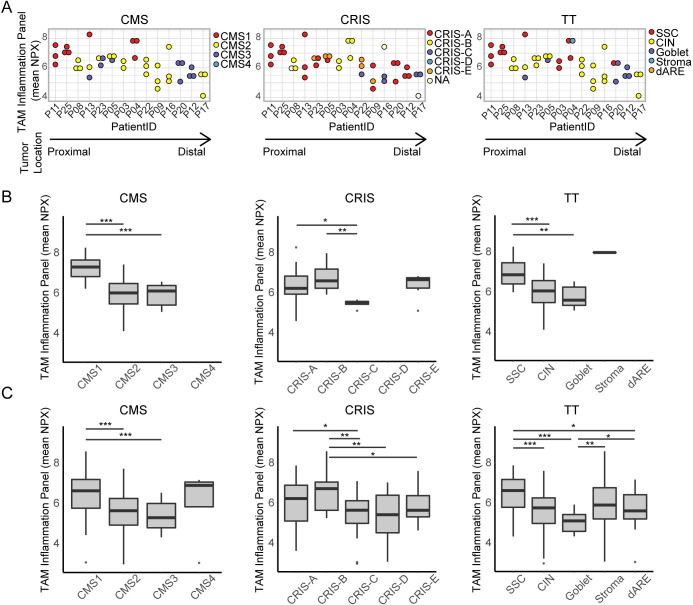
Fig 5. TAM Inflammation on protein level varies between subtypes.
(A) Dotplots showing TAM inflammation panel (mean NPX) protein level for multiregional biopsies from each tumors (n = 14) with all three classifiers (CMS, CRIS, and TT). Colors indicate transcriptional subtype. Proximal to distal tumor location is indicated by an arrow. (B) Boxplots for each classifier (CMS, CRIS, TT), showing protein inflammation panel mean for all samples (n = 41) grouped based on transcriptional subtype. (C) Boxplots for each classifier, showing protein inflammation panel mean for samples from a validation cohort (n = 162), grouped based on transcriptional subtype. (* = p<0.05; ** = p<0.01; *** = p<0.001, Wilcoxon rank sum test).

