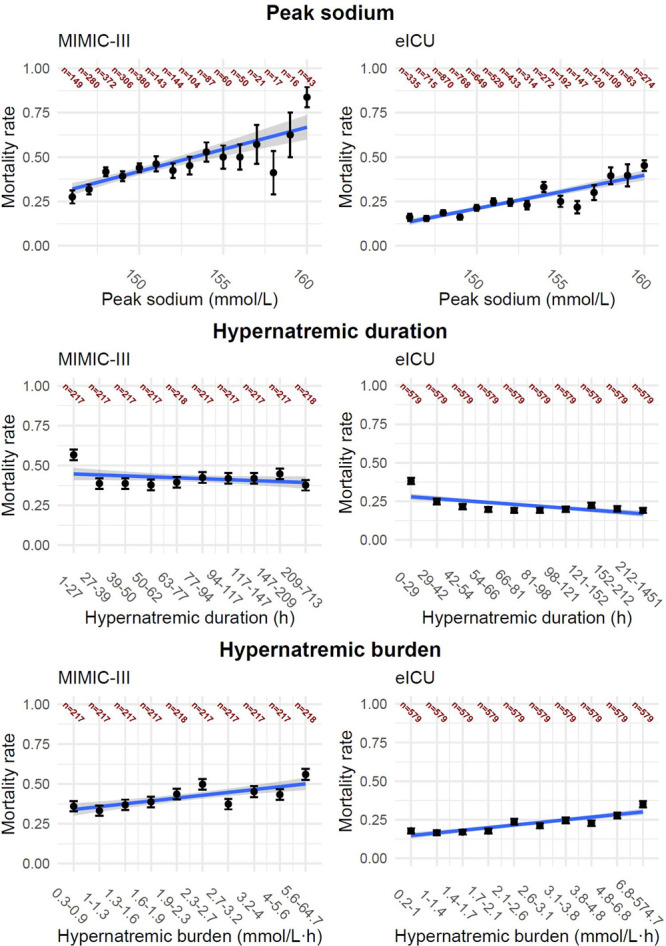
Figure 2.

Variables from the Medical Information Mart for Intensive Care III (MIMIC-III) (left column) and electronic ICU (eICU) (right column) database associated with in-hospital mortality. Top row presents the mortality rate based on maximum sodium value (peak sodium). Patients with peak sodium within normal range but below 140 mmol/L were combined in one group, and patients with maximum values above 156 mmol/L were combined another group. Middle row presents the accumulated hypernatremic duration and the association with in-hospital mortality, and the bottom row shows the association between hypernatremic burden and mortality. The line (blue) shows the univariable regression line. The groups for duration and burden are stratified based on group size, which are presented in dark red.
