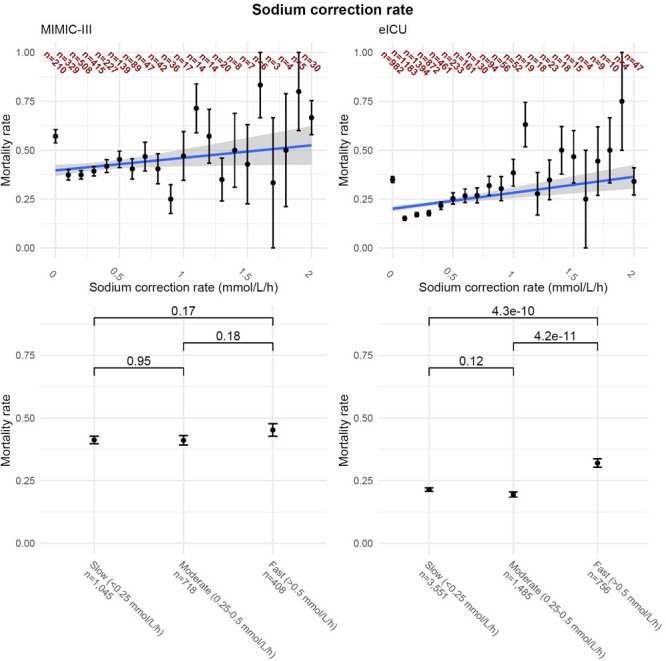
Figure 3.

Correction rates of hypernatremic patients. Left column is Medical Information Mart for Intensive Care III (MIMIC-III), while the right column is electronic ICU (eICU). Upper row presents mortality rate based on maximum correction rate with aggregated values greater than 15 to 15 mmol/L, with numbers in each group presented with dark red. Lower row presents the mortality rate based on three groups. p value shown is the Fisher exact test, with Bonferroni correction.
