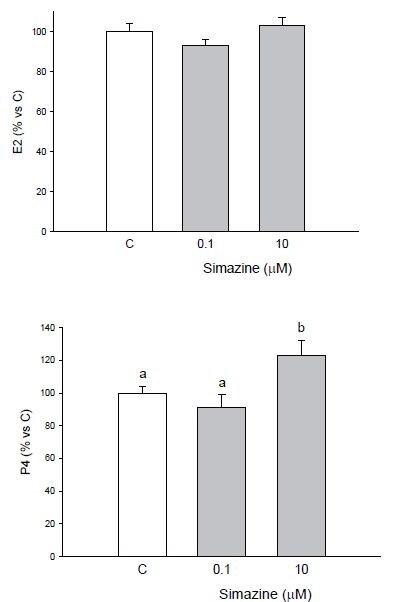
Figure 3. Effect of the 48 h treatment with simazine (0.1 or 10 µM) on E2 (A) or P4 (B) output by granulosa cells collected from large (>5 mm) follicles. Data represent the mean ± SEM of six replicates/treatment repeated in six different experiments. Different letters indicate a significant difference (P < 0.05) among treatments as calculated by ANOVA and Scheffè’ F test.

