
Figure 1. Single cell atlas of the malignant human liver.
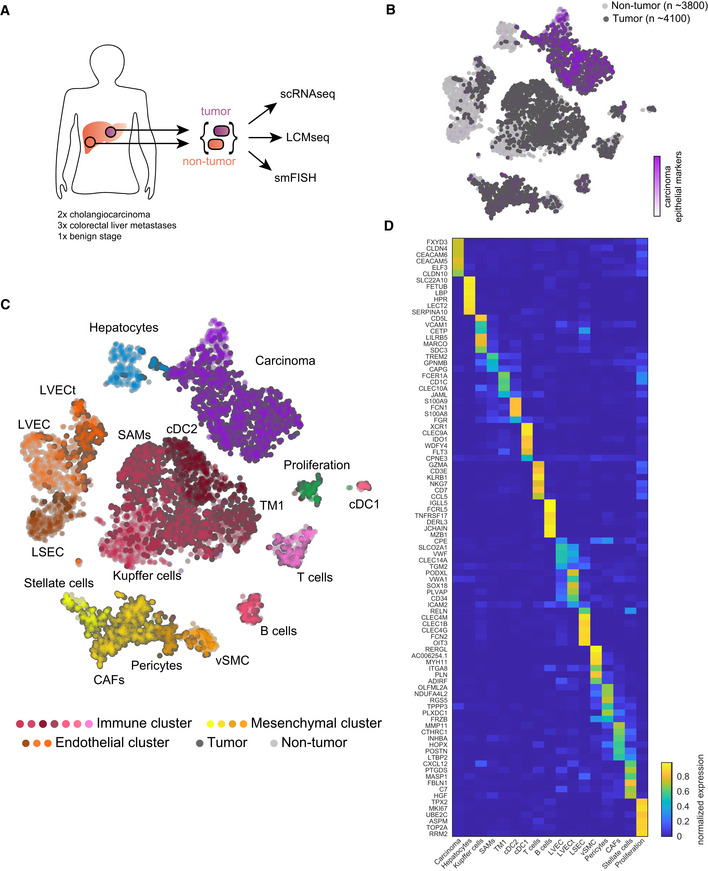
- Experimental scheme, tumor, and adjacent non‐tumor liver samples from surgeries were dissociated for scRNA‐seq, frozen for LCM, and fixed for smFISH.
- tSNE plot colored by normalized sum of pan‐carcinoma markers taken form Puram et al (2017). “n”—indicates the number of cells per group.
- tSNE plot colored by the 17 Seurat clusters including hepatocytes, endothelial cells (liver sinusoidal endothelial cells—LSEC, non‐tumor liver vascular endothelial cells—LVEC, and tumor liver vascular endothelial cells—LVECt), mesenchymal cells (Stellate cells, cancer‐associated fibroblasts—CAFs, Pericytes, vascular smooth muscle cells—vSMC), immune cells (Kupffer cells, scar‐associated macrophages—SAMs, tissue monocytes 1—TM1, cDC1, cDC2, T cells, and B cells), proliferating cells, and carcinoma cells.
- Heatmap showing the normalized expression of marker genes for the different clusters (Materials and Methods). Expression is normalized by the maximal expression among all cell types.