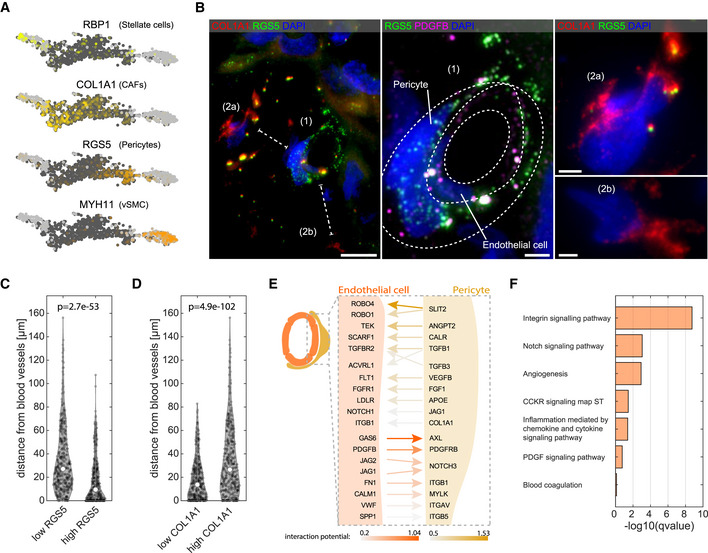
Figure 3. Mesenchymal heterogeneity in the liver malignant sites.

-
AKey marker genes for the four mesenchymal clusters (RBP1, COL1A1, RGS5, and MYH11). Light gray dots denote cells originating from non‐tumor samples. Dark gray dots denote cells originating from the tumor samples.
-
BLeft—Representative smFISH image of patient p1 stained for RGS5 and COL1A1 showing distinct spatial localization of CAFs and pericytes. Scale bar 10 µm. Dashed lines mark the shortest distance of cells (2a) and (2b) from the cell (1). Middle—zoom‐in of (1) from left panel, showing a blood vessel like structure formed by endothelial cells marked by PDGFB (magenta) wrapped by pericytes marked by RGS5 (green). Dashed lines are two consecutive cell layers of endothelial cells and pericytes. Scale bar 2.5 µm. Right—zoom‐in of (2a and b) from the left panel, showing two distant CAFs expressing high COL1A1 signal but not RGS5. DAPI used for nuclei staining. Scale bar 2.5 µm.
-
C, DViolin plot of the distance from blood vessels of low/high RGS5 expressing cells (n = 358 and n = 360, respectively) and low/high COL1A1 expressing cells (n = 359 and n = 359, respectively). “p” is the P‐value determined by Wilcoxon rank‐sum test. Empty circles are the medians over all repeats.
-
ESchematic representation of the top‐ranked interaction (bona‐fide) detected by NicheNet (Materials and Methods). Results are sorted by the prior interaction potential between pericytes and tumor LVECt cells.
-
FPathway enrichment analysis for all bona‐fide genes (Dataset EV4) using Enrichr tool. Images in this figure are representative images out of eight independent experiments over four patients.
